Immigrants from Sri Lanka vs Immigrants from Syria Unemployment Among Youth under 25 years
COMPARE
Immigrants from Sri Lanka
Immigrants from Syria
Unemployment Among Youth under 25 years
Unemployment Among Youth under 25 years Comparison
Immigrants from Sri Lanka
Immigrants from Syria
11.7%
UNEMPLOYMENT AMONG YOUTH UNDER 25 YEARS
27.8/ 100
METRIC RATING
194th/ 347
METRIC RANK
12.3%
UNEMPLOYMENT AMONG YOUTH UNDER 25 YEARS
0.3/ 100
METRIC RATING
252nd/ 347
METRIC RANK
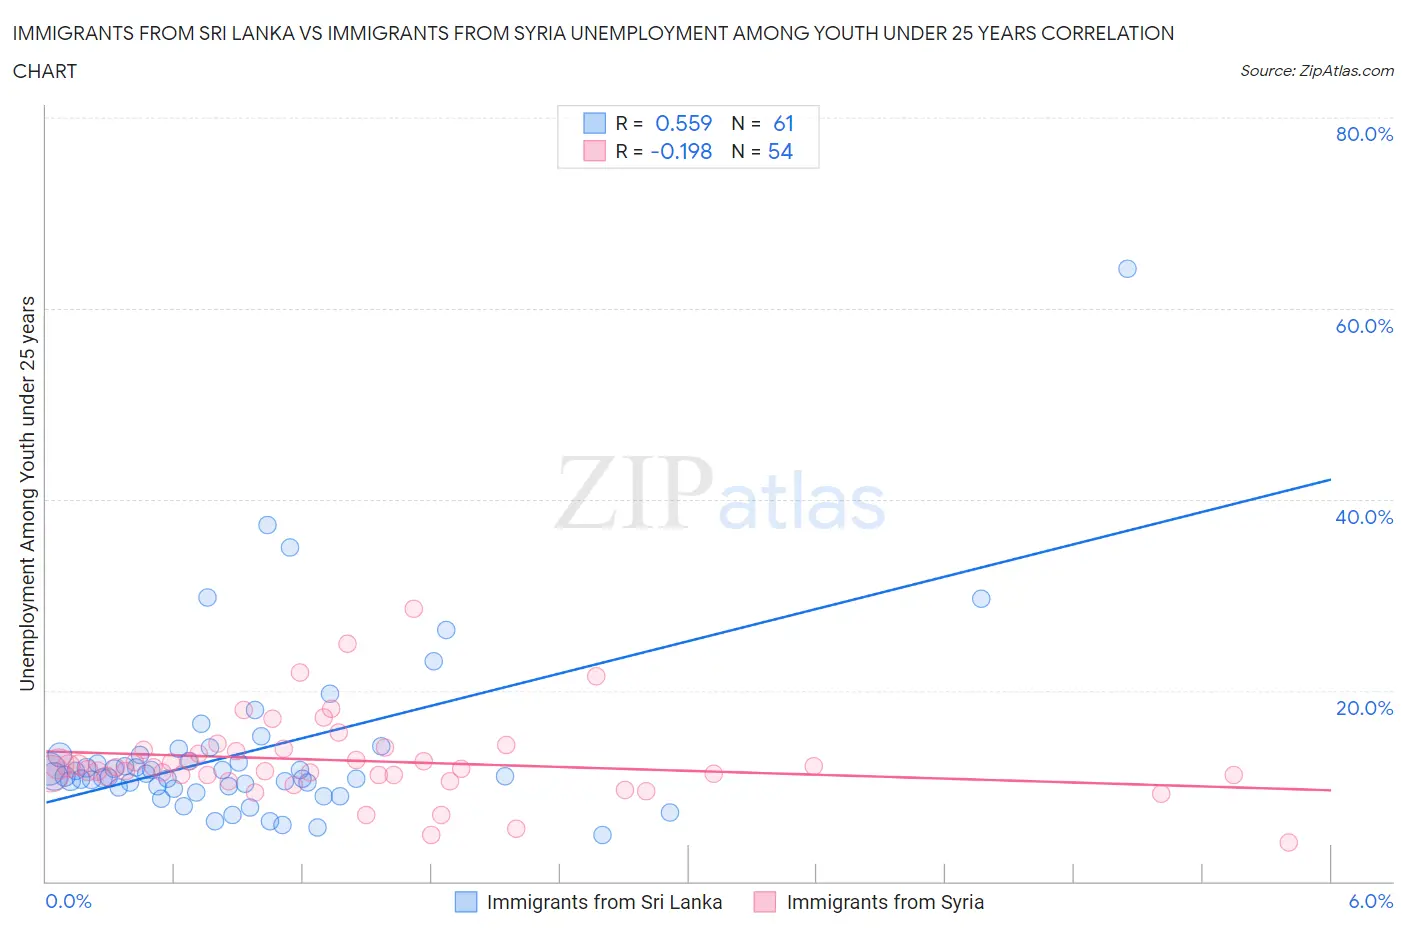
Immigrants from Sri Lanka vs Immigrants from Syria Unemployment Among Youth under 25 years Correlation Chart
The statistical analysis conducted on geographies consisting of 149,393,171 people shows a substantial positive correlation between the proportion of Immigrants from Sri Lanka and unemployment rate among youth under the age of 25 in the United States with a correlation coefficient (R) of 0.559 and weighted average of 11.7%. Similarly, the statistical analysis conducted on geographies consisting of 173,556,905 people shows a poor negative correlation between the proportion of Immigrants from Syria and unemployment rate among youth under the age of 25 in the United States with a correlation coefficient (R) of -0.198 and weighted average of 12.3%, a difference of 4.8%.
Unemployment Among Youth under 25 years Correlation Summary
| Measurement | Immigrants from Sri Lanka | Immigrants from Syria |
| Minimum | 4.9% | 4.0% |
| Maximum | 64.1% | 28.6% |
| Range | 59.2% | 24.6% |
| Mean | 13.6% | 12.6% |
| Median | 11.0% | 11.9% |
| Interquartile 25% (IQ1) | 9.9% | 11.1% |
| Interquartile 75% (IQ3) | 13.2% | 13.7% |
| Interquartile Range (IQR) | 3.3% | 2.6% |
| Standard Deviation (Sample) | 9.3% | 4.4% |
| Standard Deviation (Population) | 9.2% | 4.3% |
Similar Demographics by Unemployment Among Youth under 25 years
Demographics Similar to Immigrants from Sri Lanka by Unemployment Among Youth under 25 years
In terms of unemployment among youth under 25 years, the demographic groups most similar to Immigrants from Sri Lanka are Seminole (11.7%, a difference of 0.010%), Immigrants from Russia (11.7%, a difference of 0.030%), Paraguayan (11.7%, a difference of 0.030%), Cypriot (11.7%, a difference of 0.040%), and Egyptian (11.7%, a difference of 0.050%).
| Demographics | Rating | Rank | Unemployment Among Youth under 25 years |
| Immigrants | Egypt | 31.9 /100 | #187 | Fair 11.7% |
| Immigrants | Poland | 31.4 /100 | #188 | Fair 11.7% |
| Japanese | 30.8 /100 | #189 | Fair 11.7% |
| Portuguese | 30.3 /100 | #190 | Fair 11.7% |
| Cypriots | 28.5 /100 | #191 | Fair 11.7% |
| Immigrants | Russia | 28.5 /100 | #192 | Fair 11.7% |
| Seminole | 27.9 /100 | #193 | Fair 11.7% |
| Immigrants | Sri Lanka | 27.8 /100 | #194 | Fair 11.7% |
| Paraguayans | 27.2 /100 | #195 | Fair 11.7% |
| Egyptians | 26.9 /100 | #196 | Fair 11.7% |
| Koreans | 23.9 /100 | #197 | Fair 11.7% |
| Cherokee | 21.2 /100 | #198 | Fair 11.8% |
| Immigrants | Colombia | 20.9 /100 | #199 | Fair 11.8% |
| Arabs | 18.0 /100 | #200 | Poor 11.8% |
| Palestinians | 16.0 /100 | #201 | Poor 11.8% |
Demographics Similar to Immigrants from Syria by Unemployment Among Youth under 25 years
In terms of unemployment among youth under 25 years, the demographic groups most similar to Immigrants from Syria are Mexican American Indian (12.3%, a difference of 0.040%), Mexican (12.3%, a difference of 0.040%), Honduran (12.3%, a difference of 0.060%), Delaware (12.3%, a difference of 0.070%), and Soviet Union (12.2%, a difference of 0.49%).
| Demographics | Rating | Rank | Unemployment Among Youth under 25 years |
| Spanish Americans | 0.6 /100 | #245 | Tragic 12.2% |
| Immigrants | Honduras | 0.6 /100 | #246 | Tragic 12.2% |
| Immigrants | Greece | 0.6 /100 | #247 | Tragic 12.2% |
| Central Americans | 0.6 /100 | #248 | Tragic 12.2% |
| Soviet Union | 0.6 /100 | #249 | Tragic 12.2% |
| Delaware | 0.4 /100 | #250 | Tragic 12.3% |
| Mexican American Indians | 0.4 /100 | #251 | Tragic 12.3% |
| Immigrants | Syria | 0.3 /100 | #252 | Tragic 12.3% |
| Mexicans | 0.3 /100 | #253 | Tragic 12.3% |
| Hondurans | 0.3 /100 | #254 | Tragic 12.3% |
| Hispanics or Latinos | 0.2 /100 | #255 | Tragic 12.4% |
| Liberians | 0.2 /100 | #256 | Tragic 12.4% |
| Panamanians | 0.2 /100 | #257 | Tragic 12.4% |
| Salvadorans | 0.1 /100 | #258 | Tragic 12.4% |
| Immigrants | Central America | 0.1 /100 | #259 | Tragic 12.4% |