Immigrants from Sri Lanka vs Immigrants from Albania Female Unemployment
COMPARE
Immigrants from Sri Lanka
Immigrants from Albania
Female Unemployment
Female Unemployment Comparison
Immigrants from Sri Lanka
Immigrants from Albania
5.1%
FEMALE UNEMPLOYMENT
85.0/ 100
METRIC RATING
132nd/ 347
METRIC RANK
5.3%
FEMALE UNEMPLOYMENT
35.4/ 100
METRIC RATING
187th/ 347
METRIC RANK
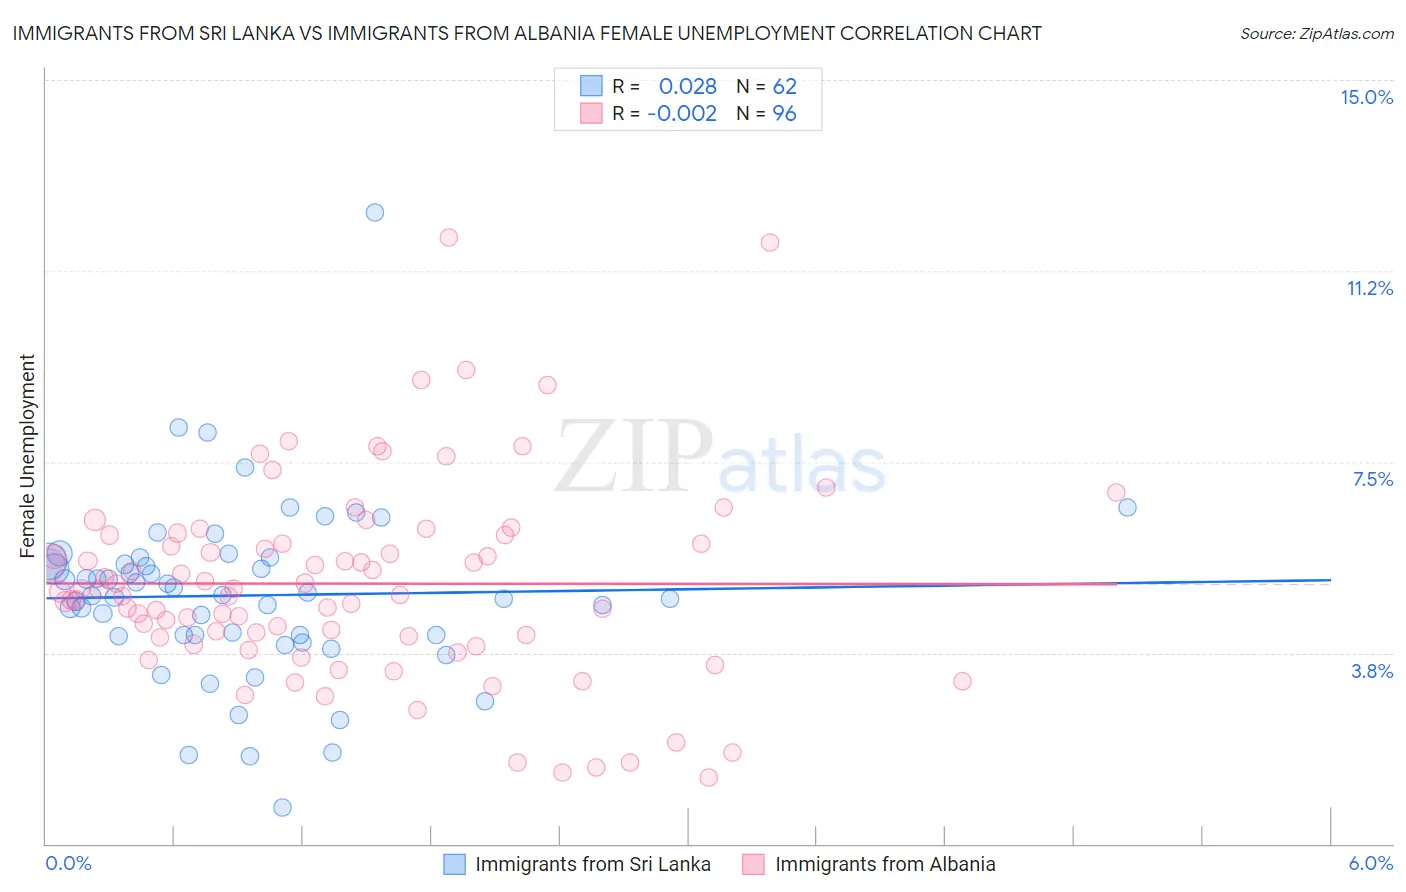
Immigrants from Sri Lanka vs Immigrants from Albania Female Unemployment Correlation Chart
The statistical analysis conducted on geographies consisting of 149,603,268 people shows no correlation between the proportion of Immigrants from Sri Lanka and unemploymnet rate among females in the United States with a correlation coefficient (R) of 0.028 and weighted average of 5.1%. Similarly, the statistical analysis conducted on geographies consisting of 119,261,752 people shows no correlation between the proportion of Immigrants from Albania and unemploymnet rate among females in the United States with a correlation coefficient (R) of -0.002 and weighted average of 5.3%, a difference of 3.6%.
Female Unemployment Correlation Summary
| Measurement | Immigrants from Sri Lanka | Immigrants from Albania |
| Minimum | 0.70% | 1.3% |
| Maximum | 12.4% | 11.9% |
| Range | 11.7% | 10.6% |
| Mean | 4.9% | 5.1% |
| Median | 4.9% | 5.0% |
| Interquartile 25% (IQ1) | 4.1% | 4.1% |
| Interquartile 75% (IQ3) | 5.5% | 6.0% |
| Interquartile Range (IQR) | 1.5% | 1.9% |
| Standard Deviation (Sample) | 1.7% | 1.9% |
| Standard Deviation (Population) | 1.7% | 1.9% |
Similar Demographics by Female Unemployment
Demographics Similar to Immigrants from Sri Lanka by Female Unemployment
In terms of female unemployment, the demographic groups most similar to Immigrants from Sri Lanka are Immigrants from Hong Kong (5.1%, a difference of 0.020%), Immigrants from Eritrea (5.1%, a difference of 0.040%), Immigrants from Ethiopia (5.1%, a difference of 0.050%), Immigrants from Latvia (5.1%, a difference of 0.050%), and Maltese (5.1%, a difference of 0.070%).
| Demographics | Rating | Rank | Female Unemployment |
| Basques | 86.5 /100 | #125 | Excellent 5.1% |
| Immigrants | Korea | 86.3 /100 | #126 | Excellent 5.1% |
| Immigrants | Hungary | 86.0 /100 | #127 | Excellent 5.1% |
| Chileans | 85.8 /100 | #128 | Excellent 5.1% |
| Ethiopians | 85.7 /100 | #129 | Excellent 5.1% |
| Maltese | 85.5 /100 | #130 | Excellent 5.1% |
| Immigrants | Ethiopia | 85.4 /100 | #131 | Excellent 5.1% |
| Immigrants | Sri Lanka | 85.0 /100 | #132 | Excellent 5.1% |
| Immigrants | Hong Kong | 84.8 /100 | #133 | Excellent 5.1% |
| Immigrants | Eritrea | 84.6 /100 | #134 | Excellent 5.1% |
| Immigrants | Latvia | 84.6 /100 | #135 | Excellent 5.1% |
| Indians (Asian) | 84.2 /100 | #136 | Excellent 5.1% |
| Pakistanis | 83.8 /100 | #137 | Excellent 5.1% |
| Chickasaw | 83.2 /100 | #138 | Excellent 5.1% |
| Immigrants | Eastern Asia | 83.0 /100 | #139 | Excellent 5.1% |
Demographics Similar to Immigrants from Albania by Female Unemployment
In terms of female unemployment, the demographic groups most similar to Immigrants from Albania are Afghan (5.3%, a difference of 0.10%), Costa Rican (5.3%, a difference of 0.10%), Immigrants from Belarus (5.3%, a difference of 0.26%), Ugandan (5.3%, a difference of 0.28%), and Immigrants from Ukraine (5.3%, a difference of 0.30%).
| Demographics | Rating | Rank | Female Unemployment |
| Immigrants | Congo | 43.1 /100 | #180 | Average 5.3% |
| Taiwanese | 42.7 /100 | #181 | Average 5.3% |
| Immigrants | Nonimmigrants | 42.6 /100 | #182 | Average 5.3% |
| Immigrants | Indonesia | 40.7 /100 | #183 | Average 5.3% |
| Immigrants | Ukraine | 40.1 /100 | #184 | Average 5.3% |
| Malaysians | 40.1 /100 | #185 | Average 5.3% |
| Immigrants | Belarus | 39.4 /100 | #186 | Fair 5.3% |
| Immigrants | Albania | 35.4 /100 | #187 | Fair 5.3% |
| Afghans | 33.9 /100 | #188 | Fair 5.3% |
| Costa Ricans | 33.8 /100 | #189 | Fair 5.3% |
| Ugandans | 31.2 /100 | #190 | Fair 5.3% |
| Cherokee | 30.8 /100 | #191 | Fair 5.3% |
| Portuguese | 28.6 /100 | #192 | Fair 5.3% |
| Arabs | 27.7 /100 | #193 | Fair 5.3% |
| Colombians | 27.0 /100 | #194 | Fair 5.3% |