Black/African American vs Immigrants from Albania Female Unemployment
COMPARE
Black/African American
Immigrants from Albania
Female Unemployment
Female Unemployment Comparison
Blacks/African Americans
Immigrants from Albania
6.5%
FEMALE UNEMPLOYMENT
0.0/ 100
METRIC RATING
321st/ 347
METRIC RANK
5.3%
FEMALE UNEMPLOYMENT
35.4/ 100
METRIC RATING
187th/ 347
METRIC RANK
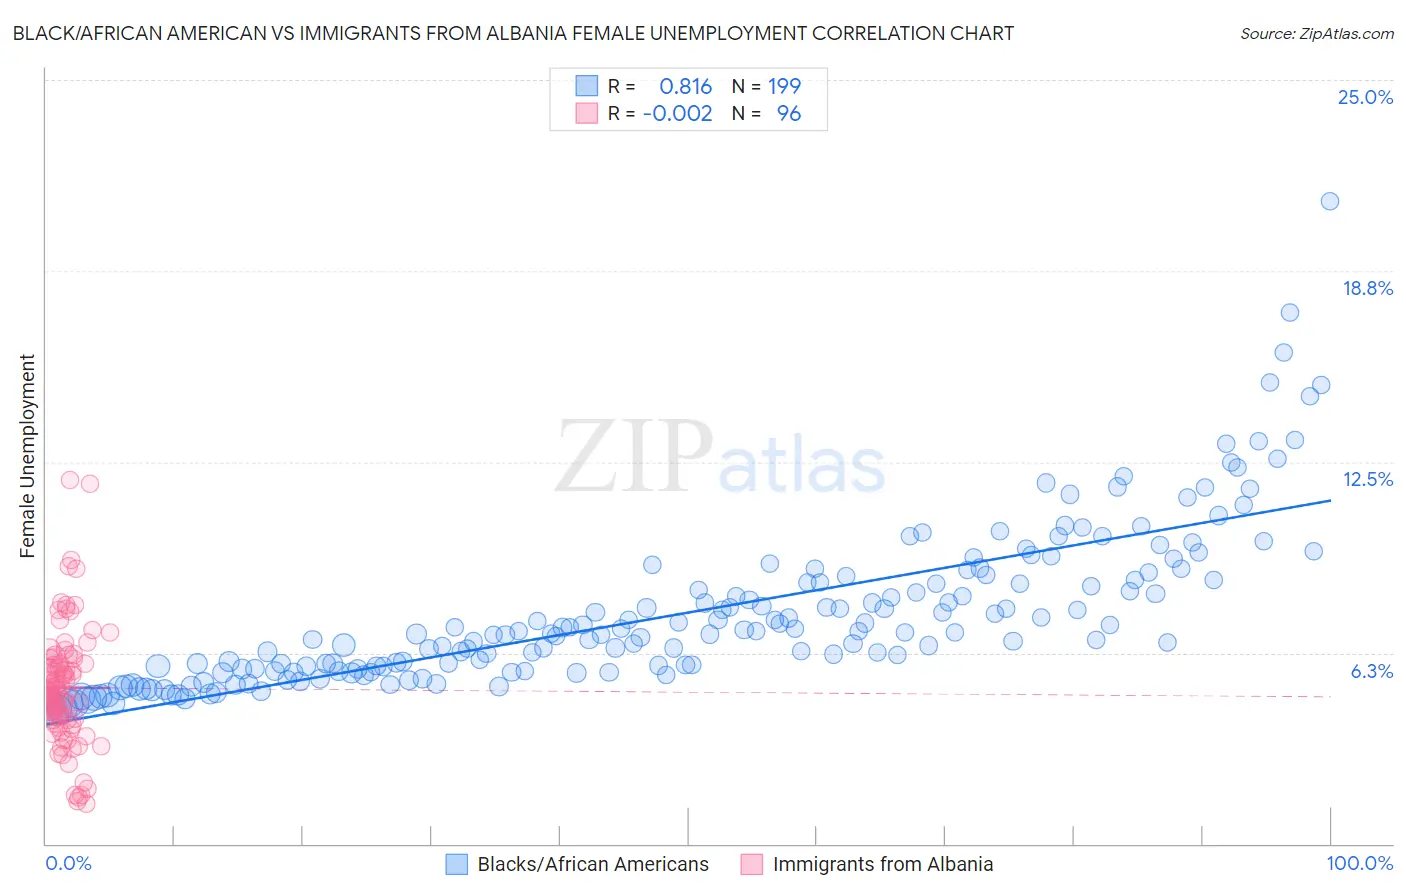
Black/African American vs Immigrants from Albania Female Unemployment Correlation Chart
The statistical analysis conducted on geographies consisting of 554,894,161 people shows a very strong positive correlation between the proportion of Blacks/African Americans and unemploymnet rate among females in the United States with a correlation coefficient (R) of 0.816 and weighted average of 6.5%. Similarly, the statistical analysis conducted on geographies consisting of 119,261,752 people shows no correlation between the proportion of Immigrants from Albania and unemploymnet rate among females in the United States with a correlation coefficient (R) of -0.002 and weighted average of 5.3%, a difference of 22.4%.
Female Unemployment Correlation Summary
| Measurement | Black/African American | Immigrants from Albania |
| Minimum | 4.4% | 1.3% |
| Maximum | 21.0% | 11.9% |
| Range | 16.6% | 10.6% |
| Mean | 7.6% | 5.1% |
| Median | 6.9% | 5.0% |
| Interquartile 25% (IQ1) | 5.7% | 4.1% |
| Interquartile 75% (IQ3) | 8.6% | 6.0% |
| Interquartile Range (IQR) | 2.9% | 1.9% |
| Standard Deviation (Sample) | 2.6% | 1.9% |
| Standard Deviation (Population) | 2.6% | 1.9% |
Similar Demographics by Female Unemployment
Demographics Similar to Blacks/African Americans by Female Unemployment
In terms of female unemployment, the demographic groups most similar to Blacks/African Americans are Vietnamese (6.5%, a difference of 0.080%), Immigrants from Belize (6.5%, a difference of 0.18%), Immigrants from Dominica (6.5%, a difference of 0.54%), Immigrants from Bangladesh (6.5%, a difference of 0.55%), and British West Indian (6.4%, a difference of 0.74%).
| Demographics | Rating | Rank | Female Unemployment |
| Immigrants | Ecuador | 0.0 /100 | #314 | Tragic 6.4% |
| Pueblo | 0.0 /100 | #315 | Tragic 6.4% |
| Houma | 0.0 /100 | #316 | Tragic 6.4% |
| Immigrants | St. Vincent and the Grenadines | 0.0 /100 | #317 | Tragic 6.4% |
| British West Indians | 0.0 /100 | #318 | Tragic 6.4% |
| Immigrants | Bangladesh | 0.0 /100 | #319 | Tragic 6.5% |
| Immigrants | Dominica | 0.0 /100 | #320 | Tragic 6.5% |
| Blacks/African Americans | 0.0 /100 | #321 | Tragic 6.5% |
| Vietnamese | 0.0 /100 | #322 | Tragic 6.5% |
| Immigrants | Belize | 0.0 /100 | #323 | Tragic 6.5% |
| Cheyenne | 0.0 /100 | #324 | Tragic 6.6% |
| Apache | 0.0 /100 | #325 | Tragic 6.6% |
| Natives/Alaskans | 0.0 /100 | #326 | Tragic 6.6% |
| Alaska Natives | 0.0 /100 | #327 | Tragic 6.6% |
| Guyanese | 0.0 /100 | #328 | Tragic 6.7% |
Demographics Similar to Immigrants from Albania by Female Unemployment
In terms of female unemployment, the demographic groups most similar to Immigrants from Albania are Afghan (5.3%, a difference of 0.10%), Costa Rican (5.3%, a difference of 0.10%), Immigrants from Belarus (5.3%, a difference of 0.26%), Ugandan (5.3%, a difference of 0.28%), and Immigrants from Ukraine (5.3%, a difference of 0.30%).
| Demographics | Rating | Rank | Female Unemployment |
| Immigrants | Congo | 43.1 /100 | #180 | Average 5.3% |
| Taiwanese | 42.7 /100 | #181 | Average 5.3% |
| Immigrants | Nonimmigrants | 42.6 /100 | #182 | Average 5.3% |
| Immigrants | Indonesia | 40.7 /100 | #183 | Average 5.3% |
| Immigrants | Ukraine | 40.1 /100 | #184 | Average 5.3% |
| Malaysians | 40.1 /100 | #185 | Average 5.3% |
| Immigrants | Belarus | 39.4 /100 | #186 | Fair 5.3% |
| Immigrants | Albania | 35.4 /100 | #187 | Fair 5.3% |
| Afghans | 33.9 /100 | #188 | Fair 5.3% |
| Costa Ricans | 33.8 /100 | #189 | Fair 5.3% |
| Ugandans | 31.2 /100 | #190 | Fair 5.3% |
| Cherokee | 30.8 /100 | #191 | Fair 5.3% |
| Portuguese | 28.6 /100 | #192 | Fair 5.3% |
| Arabs | 27.7 /100 | #193 | Fair 5.3% |
| Colombians | 27.0 /100 | #194 | Fair 5.3% |