Costa Rican vs Dominican Unemployment Among Ages 16 to 19 years
COMPARE
Costa Rican
Dominican
Unemployment Among Ages 16 to 19 years
Unemployment Among Ages 16 to 19 years Comparison
Costa Ricans
Dominicans
17.4%
UNEMPLOYMENT AMONG AGES 16 TO 19 YEARS
65.9/ 100
METRIC RATING
156th/ 347
METRIC RANK
23.6%
UNEMPLOYMENT AMONG AGES 16 TO 19 YEARS
0.0/ 100
METRIC RATING
330th/ 347
METRIC RANK
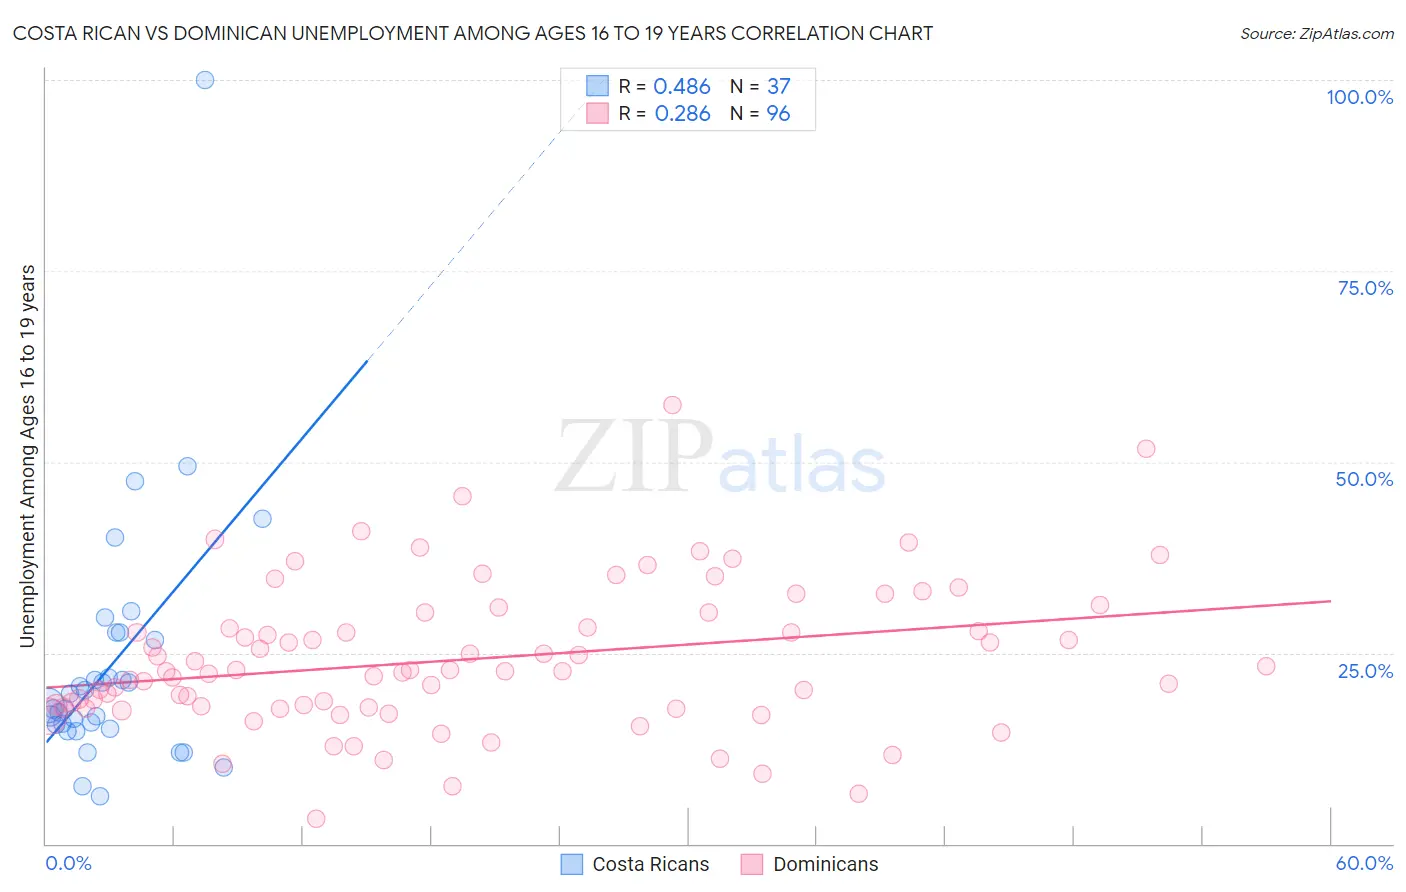
Costa Rican vs Dominican Unemployment Among Ages 16 to 19 years Correlation Chart
The statistical analysis conducted on geographies consisting of 245,990,367 people shows a moderate positive correlation between the proportion of Costa Ricans and unemployment rate among population between the ages 16 and 19 in the United States with a correlation coefficient (R) of 0.486 and weighted average of 17.4%. Similarly, the statistical analysis conducted on geographies consisting of 338,410,900 people shows a weak positive correlation between the proportion of Dominicans and unemployment rate among population between the ages 16 and 19 in the United States with a correlation coefficient (R) of 0.286 and weighted average of 23.6%, a difference of 35.6%.
Unemployment Among Ages 16 to 19 years Correlation Summary
| Measurement | Costa Rican | Dominican |
| Minimum | 6.3% | 3.2% |
| Maximum | 100.0% | 57.4% |
| Range | 93.7% | 54.2% |
| Mean | 23.3% | 24.2% |
| Median | 18.1% | 22.6% |
| Interquartile 25% (IQ1) | 15.3% | 17.8% |
| Interquartile 75% (IQ3) | 27.1% | 29.3% |
| Interquartile Range (IQR) | 11.8% | 11.4% |
| Standard Deviation (Sample) | 16.5% | 9.6% |
| Standard Deviation (Population) | 16.2% | 9.6% |
Similar Demographics by Unemployment Among Ages 16 to 19 years
Demographics Similar to Costa Ricans by Unemployment Among Ages 16 to 19 years
In terms of unemployment among ages 16 to 19 years, the demographic groups most similar to Costa Ricans are Portuguese (17.4%, a difference of 0.070%), Uruguayan (17.5%, a difference of 0.080%), Immigrants from China (17.5%, a difference of 0.090%), Afghan (17.4%, a difference of 0.12%), and Immigrants from Afghanistan (17.4%, a difference of 0.14%).
| Demographics | Rating | Rank | Unemployment Among Ages 16 to 19 years |
| Immigrants | Eastern Asia | 73.8 /100 | #149 | Good 17.4% |
| Immigrants | Northern Europe | 72.5 /100 | #150 | Good 17.4% |
| Immigrants | Hong Kong | 69.3 /100 | #151 | Good 17.4% |
| Immigrants | Northern Africa | 69.0 /100 | #152 | Good 17.4% |
| Immigrants | Afghanistan | 68.6 /100 | #153 | Good 17.4% |
| Afghans | 68.1 /100 | #154 | Good 17.4% |
| Portuguese | 67.3 /100 | #155 | Good 17.4% |
| Costa Ricans | 65.9 /100 | #156 | Good 17.4% |
| Uruguayans | 64.3 /100 | #157 | Good 17.5% |
| Immigrants | China | 64.1 /100 | #158 | Good 17.5% |
| Koreans | 61.0 /100 | #159 | Good 17.5% |
| Ukrainians | 60.5 /100 | #160 | Good 17.5% |
| Immigrants | Denmark | 60.3 /100 | #161 | Good 17.5% |
| Immigrants | Norway | 59.8 /100 | #162 | Average 17.5% |
| Egyptians | 59.7 /100 | #163 | Average 17.5% |
Demographics Similar to Dominicans by Unemployment Among Ages 16 to 19 years
In terms of unemployment among ages 16 to 19 years, the demographic groups most similar to Dominicans are Tlingit-Haida (23.5%, a difference of 0.44%), British West Indian (24.0%, a difference of 1.4%), Immigrants from Dominican Republic (23.3%, a difference of 1.5%), Immigrants from Barbados (24.0%, a difference of 1.6%), and Pima (23.1%, a difference of 2.2%).
| Demographics | Rating | Rank | Unemployment Among Ages 16 to 19 years |
| Yakama | 0.0 /100 | #323 | Tragic 22.5% |
| Immigrants | Armenia | 0.0 /100 | #324 | Tragic 22.6% |
| Trinidadians and Tobagonians | 0.0 /100 | #325 | Tragic 22.6% |
| Immigrants | Trinidad and Tobago | 0.0 /100 | #326 | Tragic 23.1% |
| Pima | 0.0 /100 | #327 | Tragic 23.1% |
| Immigrants | Dominican Republic | 0.0 /100 | #328 | Tragic 23.3% |
| Tlingit-Haida | 0.0 /100 | #329 | Tragic 23.5% |
| Dominicans | 0.0 /100 | #330 | Tragic 23.6% |
| British West Indians | 0.0 /100 | #331 | Tragic 24.0% |
| Immigrants | Barbados | 0.0 /100 | #332 | Tragic 24.0% |
| Paiute | 0.0 /100 | #333 | Tragic 24.4% |
| Guyanese | 0.0 /100 | #334 | Tragic 24.8% |
| Arapaho | 0.0 /100 | #335 | Tragic 25.2% |
| Kiowa | 0.0 /100 | #336 | Tragic 25.2% |
| Immigrants | Guyana | 0.0 /100 | #337 | Tragic 25.5% |