Immigrants from Sri Lanka vs Chinese Unemployment Among Ages 16 to 19 years
COMPARE
Immigrants from Sri Lanka
Chinese
Unemployment Among Ages 16 to 19 years
Unemployment Among Ages 16 to 19 years Comparison
Immigrants from Sri Lanka
Chinese
17.1%
UNEMPLOYMENT AMONG AGES 16 TO 19 YEARS
92.0/ 100
METRIC RATING
117th/ 347
METRIC RANK
16.0%
UNEMPLOYMENT AMONG AGES 16 TO 19 YEARS
99.9/ 100
METRIC RATING
29th/ 347
METRIC RANK
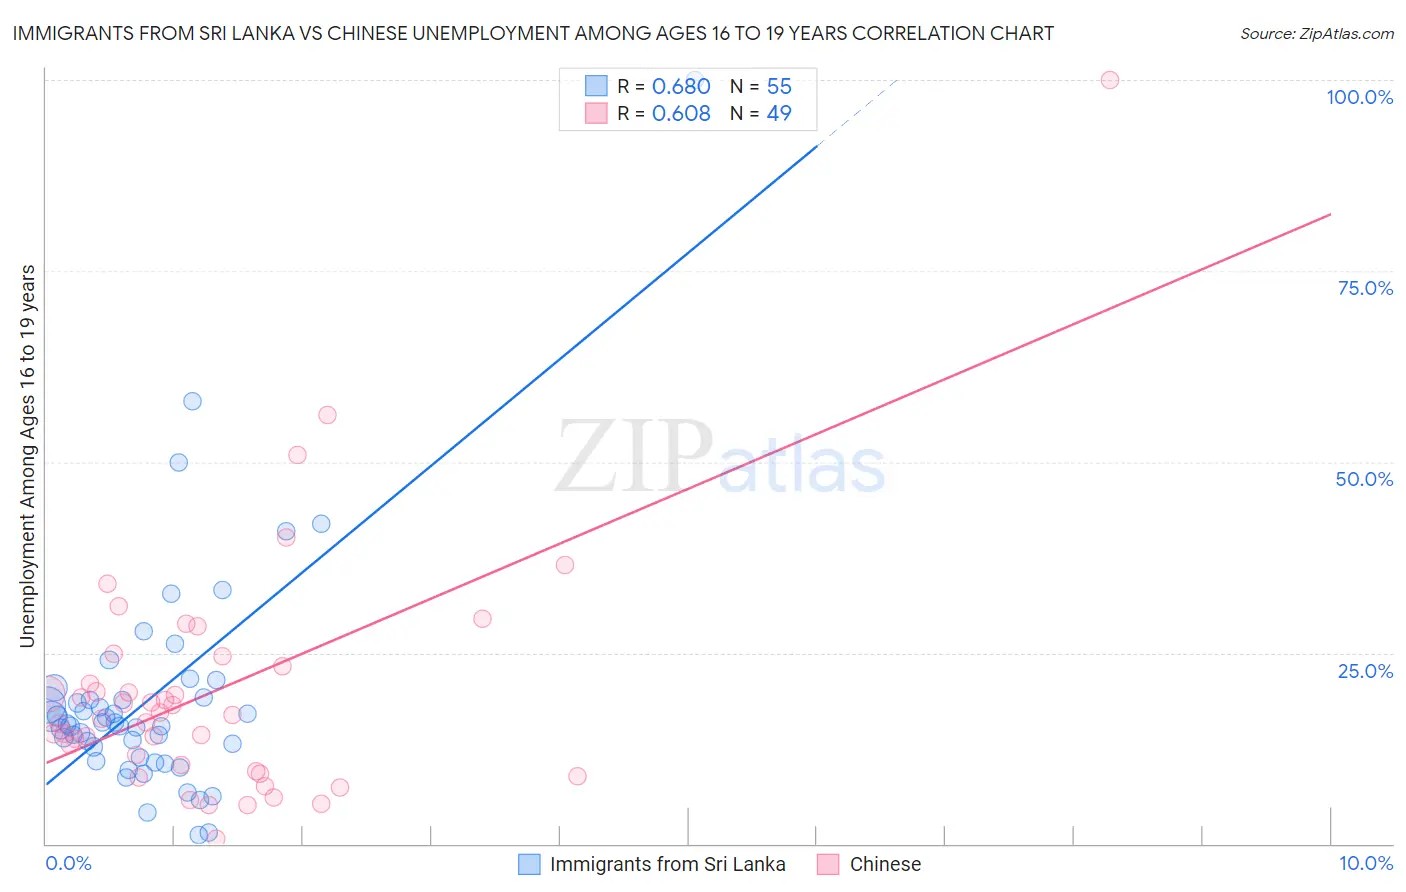
Immigrants from Sri Lanka vs Chinese Unemployment Among Ages 16 to 19 years Correlation Chart
The statistical analysis conducted on geographies consisting of 146,697,402 people shows a significant positive correlation between the proportion of Immigrants from Sri Lanka and unemployment rate among population between the ages 16 and 19 in the United States with a correlation coefficient (R) of 0.680 and weighted average of 17.1%. Similarly, the statistical analysis conducted on geographies consisting of 63,869,699 people shows a significant positive correlation between the proportion of Chinese and unemployment rate among population between the ages 16 and 19 in the United States with a correlation coefficient (R) of 0.608 and weighted average of 16.0%, a difference of 6.4%.
Unemployment Among Ages 16 to 19 years Correlation Summary
| Measurement | Immigrants from Sri Lanka | Chinese |
| Minimum | 1.2% | 0.70% |
| Maximum | 100.0% | 100.0% |
| Range | 98.8% | 99.3% |
| Mean | 19.1% | 20.0% |
| Median | 15.7% | 16.8% |
| Interquartile 25% (IQ1) | 11.2% | 9.9% |
| Interquartile 75% (IQ3) | 19.2% | 23.9% |
| Interquartile Range (IQR) | 8.0% | 14.0% |
| Standard Deviation (Sample) | 15.5% | 16.3% |
| Standard Deviation (Population) | 15.3% | 16.1% |
Similar Demographics by Unemployment Among Ages 16 to 19 years
Demographics Similar to Immigrants from Sri Lanka by Unemployment Among Ages 16 to 19 years
In terms of unemployment among ages 16 to 19 years, the demographic groups most similar to Immigrants from Sri Lanka are Venezuelan (17.1%, a difference of 0.020%), Immigrants from Korea (17.1%, a difference of 0.030%), Brazilian (17.1%, a difference of 0.050%), Hungarian (17.1%, a difference of 0.060%), and Immigrants from Middle Africa (17.1%, a difference of 0.17%).
| Demographics | Rating | Rank | Unemployment Among Ages 16 to 19 years |
| Immigrants | Netherlands | 93.9 /100 | #110 | Exceptional 17.0% |
| Immigrants | Asia | 93.9 /100 | #111 | Exceptional 17.0% |
| Immigrants | Iraq | 93.7 /100 | #112 | Exceptional 17.0% |
| Icelanders | 93.4 /100 | #113 | Exceptional 17.0% |
| Immigrants | Poland | 93.1 /100 | #114 | Exceptional 17.0% |
| Brazilians | 92.3 /100 | #115 | Exceptional 17.1% |
| Immigrants | Korea | 92.2 /100 | #116 | Exceptional 17.1% |
| Immigrants | Sri Lanka | 92.0 /100 | #117 | Exceptional 17.1% |
| Venezuelans | 91.8 /100 | #118 | Exceptional 17.1% |
| Hungarians | 91.6 /100 | #119 | Exceptional 17.1% |
| Immigrants | Middle Africa | 90.9 /100 | #120 | Exceptional 17.1% |
| Immigrants | Moldova | 90.7 /100 | #121 | Exceptional 17.1% |
| Immigrants | South Eastern Asia | 90.7 /100 | #122 | Exceptional 17.1% |
| Immigrants | Laos | 88.8 /100 | #123 | Excellent 17.1% |
| Syrians | 88.6 /100 | #124 | Excellent 17.1% |
Demographics Similar to Chinese by Unemployment Among Ages 16 to 19 years
In terms of unemployment among ages 16 to 19 years, the demographic groups most similar to Chinese are Kenyan (16.1%, a difference of 0.040%), Jordanian (16.0%, a difference of 0.050%), English (16.1%, a difference of 0.090%), Immigrants from Sudan (16.0%, a difference of 0.23%), and European (16.1%, a difference of 0.48%).
| Demographics | Rating | Rank | Unemployment Among Ages 16 to 19 years |
| Finns | 100.0 /100 | #22 | Exceptional 15.9% |
| Belgians | 100.0 /100 | #23 | Exceptional 15.9% |
| Tongans | 100.0 /100 | #24 | Exceptional 15.9% |
| Filipinos | 100.0 /100 | #25 | Exceptional 15.9% |
| Dutch | 100.0 /100 | #26 | Exceptional 15.9% |
| Immigrants | Sudan | 99.9 /100 | #27 | Exceptional 16.0% |
| Jordanians | 99.9 /100 | #28 | Exceptional 16.0% |
| Chinese | 99.9 /100 | #29 | Exceptional 16.0% |
| Kenyans | 99.9 /100 | #30 | Exceptional 16.1% |
| English | 99.9 /100 | #31 | Exceptional 16.1% |
| Europeans | 99.9 /100 | #32 | Exceptional 16.1% |
| Immigrants | Kenya | 99.9 /100 | #33 | Exceptional 16.2% |
| Pennsylvania Germans | 99.9 /100 | #34 | Exceptional 16.2% |
| Scottish | 99.8 /100 | #35 | Exceptional 16.2% |
| Immigrants | South Central Asia | 99.8 /100 | #36 | Exceptional 16.2% |