Immigrants from Southern Europe vs Pennsylvania German Unemployment Among Women with Children Ages 6 to 17 years
COMPARE
Immigrants from Southern Europe
Pennsylvania German
Unemployment Among Women with Children Ages 6 to 17 years
Unemployment Among Women with Children Ages 6 to 17 years Comparison
Immigrants from Southern Europe
Pennsylvania Germans
9.2%
UNEMPLOYMENT AMONG WOMEN WITH CHILDREN AGES 6 TO 17 YEARS
5.8/ 100
METRIC RATING
222nd/ 347
METRIC RANK
11.0%
UNEMPLOYMENT AMONG WOMEN WITH CHILDREN AGES 6 TO 17 YEARS
0.0/ 100
METRIC RATING
329th/ 347
METRIC RANK
Immigrants from Southern Europe vs Pennsylvania German Unemployment Among Women with Children Ages 6 to 17 years Correlation Chart
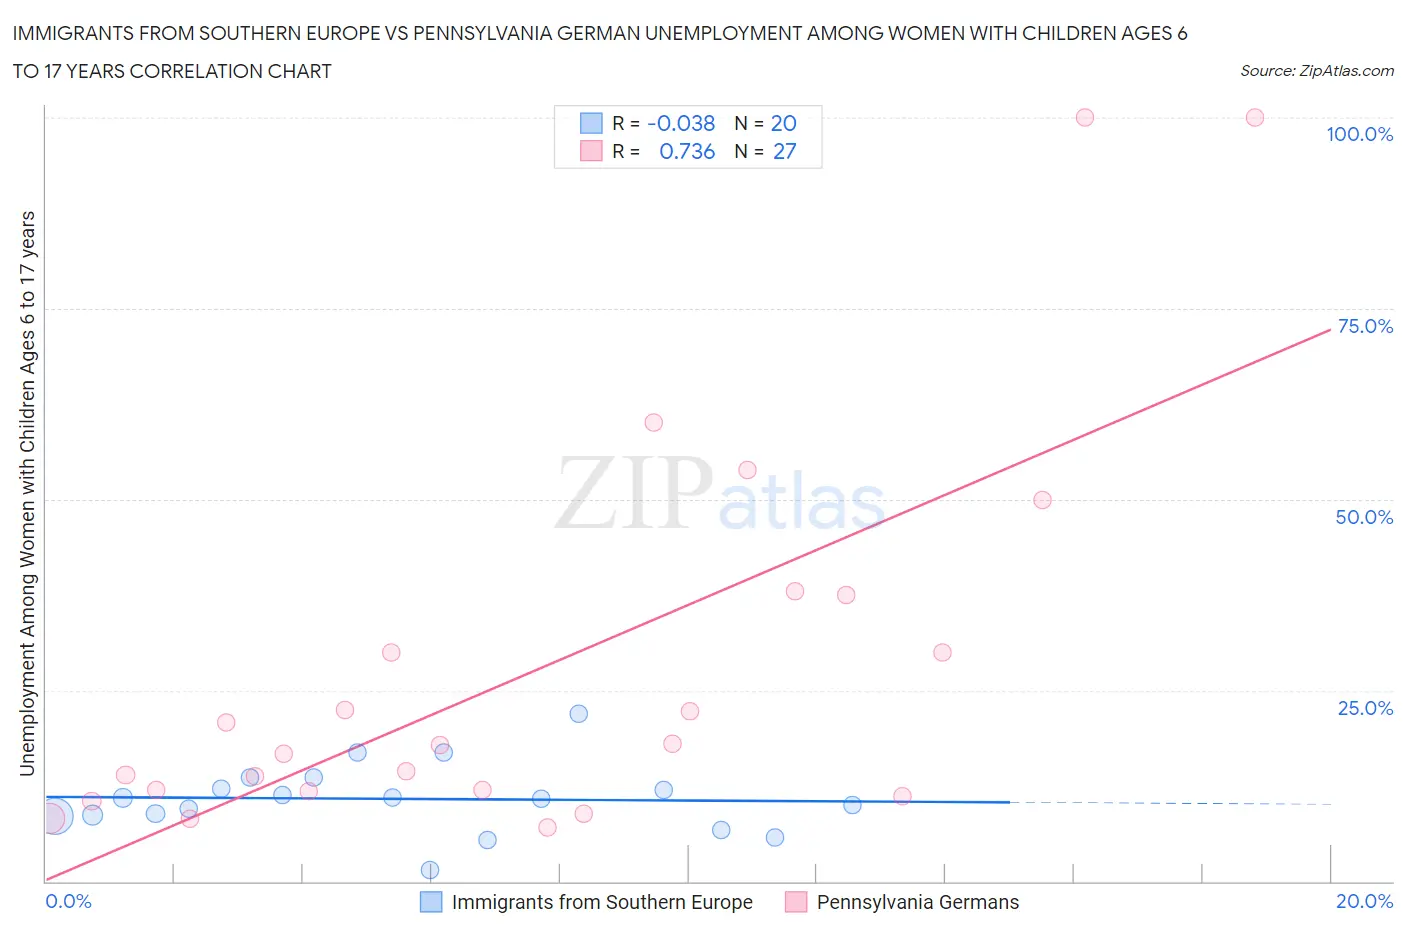
The statistical analysis conducted on geographies consisting of 285,916,862 people shows no correlation between the proportion of Immigrants from Southern Europe and unemployment rate among women with children between the ages 6 and 17 in the United States with a correlation coefficient (R) of -0.038 and weighted average of 9.2%. Similarly, the statistical analysis conducted on geographies consisting of 176,093,273 people shows a strong positive correlation between the proportion of Pennsylvania Germans and unemployment rate among women with children between the ages 6 and 17 in the United States with a correlation coefficient (R) of 0.736 and weighted average of 11.0%, a difference of 19.4%.
Unemployment Among Women with Children Ages 6 to 17 years Correlation Summary
| Measurement | Immigrants from Southern Europe | Pennsylvania German |
| Minimum | 1.4% | 7.1% |
| Maximum | 22.0% | 100.0% |
| Range | 20.6% | 92.9% |
| Mean | 10.8% | 27.7% |
| Median | 10.9% | 17.9% |
| Interquartile 25% (IQ1) | 8.6% | 11.7% |
| Interquartile 75% (IQ3) | 12.8% | 37.5% |
| Interquartile Range (IQR) | 4.2% | 25.8% |
| Standard Deviation (Sample) | 4.6% | 25.4% |
| Standard Deviation (Population) | 4.4% | 24.9% |
Similar Demographics by Unemployment Among Women with Children Ages 6 to 17 years
Demographics Similar to Immigrants from Southern Europe by Unemployment Among Women with Children Ages 6 to 17 years
In terms of unemployment among women with children ages 6 to 17 years, the demographic groups most similar to Immigrants from Southern Europe are Crow (9.2%, a difference of 0.010%), Immigrants from Eritrea (9.2%, a difference of 0.010%), Immigrants from El Salvador (9.3%, a difference of 0.11%), Belgian (9.2%, a difference of 0.12%), and Chinese (9.3%, a difference of 0.12%).
| Demographics | Rating | Rank | Unemployment Among Women with Children Ages 6 to 17 years |
| Immigrants | Germany | 7.2 /100 | #215 | Tragic 9.2% |
| Immigrants | Uruguay | 7.2 /100 | #216 | Tragic 9.2% |
| Germans | 7.2 /100 | #217 | Tragic 9.2% |
| Syrians | 6.9 /100 | #218 | Tragic 9.2% |
| Immigrants | Scotland | 6.6 /100 | #219 | Tragic 9.2% |
| Belgians | 6.4 /100 | #220 | Tragic 9.2% |
| Crow | 5.8 /100 | #221 | Tragic 9.2% |
| Immigrants | Southern Europe | 5.8 /100 | #222 | Tragic 9.2% |
| Immigrants | Eritrea | 5.8 /100 | #223 | Tragic 9.2% |
| Immigrants | El Salvador | 5.3 /100 | #224 | Tragic 9.3% |
| Chinese | 5.2 /100 | #225 | Tragic 9.3% |
| Immigrants | Azores | 4.6 /100 | #226 | Tragic 9.3% |
| Panamanians | 4.5 /100 | #227 | Tragic 9.3% |
| Estonians | 4.4 /100 | #228 | Tragic 9.3% |
| Lumbee | 4.3 /100 | #229 | Tragic 9.3% |
Demographics Similar to Pennsylvania Germans by Unemployment Among Women with Children Ages 6 to 17 years
In terms of unemployment among women with children ages 6 to 17 years, the demographic groups most similar to Pennsylvania Germans are Chippewa (11.1%, a difference of 0.48%), Ottawa (10.9%, a difference of 1.5%), Cape Verdean (10.9%, a difference of 1.6%), Liberian (10.8%, a difference of 1.7%), and Cajun (10.8%, a difference of 1.8%).
| Demographics | Rating | Rank | Unemployment Among Women with Children Ages 6 to 17 years |
| Cree | 0.0 /100 | #322 | Tragic 10.8% |
| Dominicans | 0.0 /100 | #323 | Tragic 10.8% |
| Immigrants | Dominican Republic | 0.0 /100 | #324 | Tragic 10.8% |
| Cajuns | 0.0 /100 | #325 | Tragic 10.8% |
| Liberians | 0.0 /100 | #326 | Tragic 10.8% |
| Cape Verdeans | 0.0 /100 | #327 | Tragic 10.9% |
| Ottawa | 0.0 /100 | #328 | Tragic 10.9% |
| Pennsylvania Germans | 0.0 /100 | #329 | Tragic 11.0% |
| Chippewa | 0.0 /100 | #330 | Tragic 11.1% |
| Blacks/African Americans | 0.0 /100 | #331 | Tragic 11.4% |
| Tsimshian | 0.0 /100 | #332 | Tragic 11.4% |
| Natives/Alaskans | 0.0 /100 | #333 | Tragic 11.5% |
| Ugandans | 0.0 /100 | #334 | Tragic 12.0% |
| Colville | 0.0 /100 | #335 | Tragic 12.3% |
| Houma | 0.0 /100 | #336 | Tragic 12.5% |