Immigrants from Southern Europe vs Luxembourger Female Unemployment
COMPARE
Immigrants from Southern Europe
Luxembourger
Female Unemployment
Female Unemployment Comparison
Immigrants from Southern Europe
Luxembourgers
5.3%
FEMALE UNEMPLOYMENT
46.2/ 100
METRIC RATING
178th/ 347
METRIC RANK
4.4%
FEMALE UNEMPLOYMENT
100.0/ 100
METRIC RATING
3rd/ 347
METRIC RANK
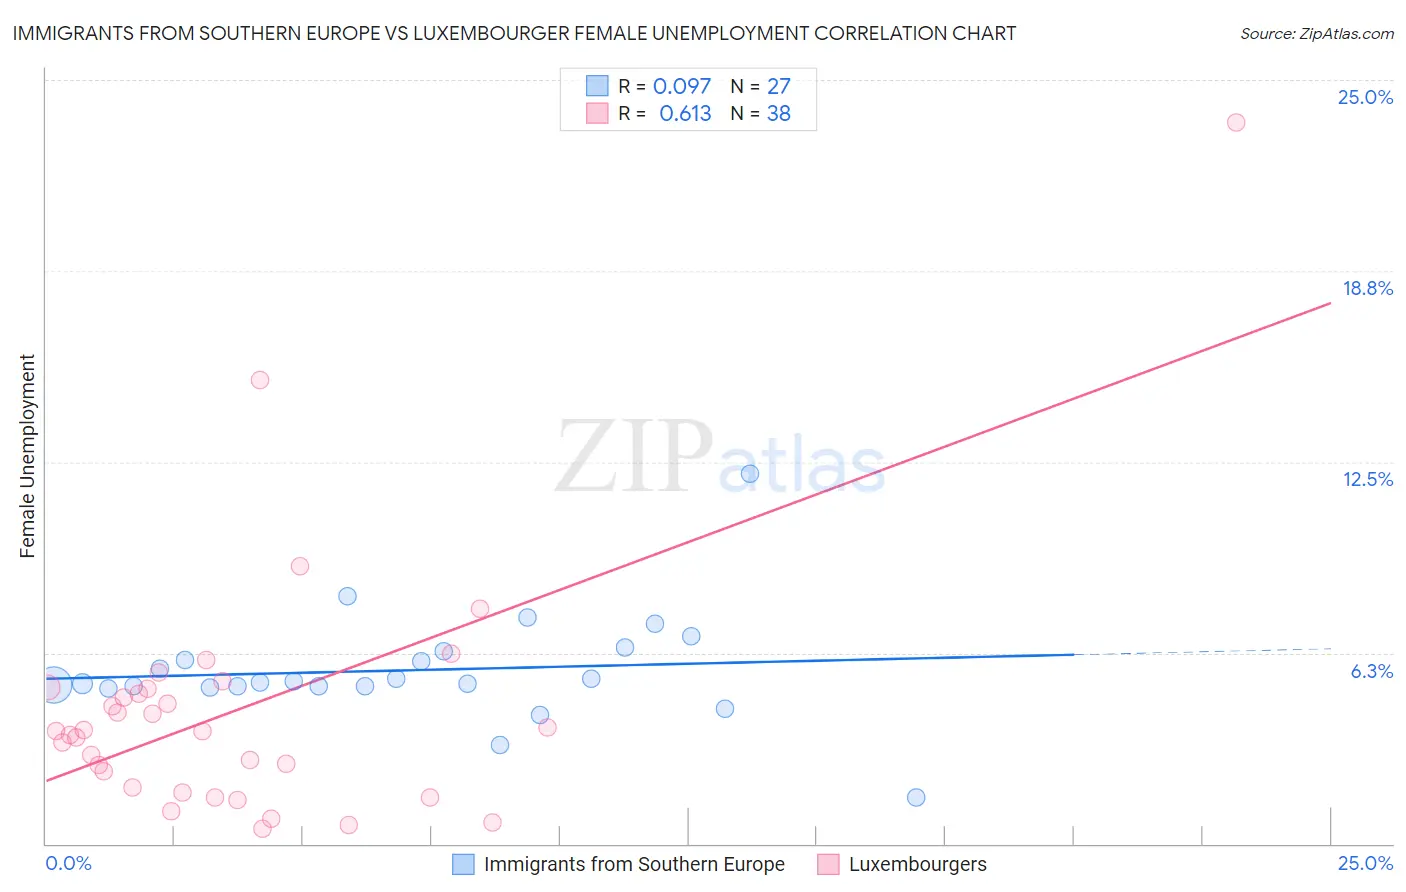
Immigrants from Southern Europe vs Luxembourger Female Unemployment Correlation Chart
The statistical analysis conducted on geographies consisting of 400,728,546 people shows a slight positive correlation between the proportion of Immigrants from Southern Europe and unemploymnet rate among females in the United States with a correlation coefficient (R) of 0.097 and weighted average of 5.3%. Similarly, the statistical analysis conducted on geographies consisting of 144,033,637 people shows a significant positive correlation between the proportion of Luxembourgers and unemploymnet rate among females in the United States with a correlation coefficient (R) of 0.613 and weighted average of 4.4%, a difference of 20.1%.
Female Unemployment Correlation Summary
| Measurement | Immigrants from Southern Europe | Luxembourger |
| Minimum | 1.5% | 0.50% |
| Maximum | 12.1% | 23.6% |
| Range | 10.6% | 23.1% |
| Mean | 5.7% | 4.4% |
| Median | 5.3% | 3.7% |
| Interquartile 25% (IQ1) | 5.1% | 1.8% |
| Interquartile 75% (IQ3) | 6.3% | 5.1% |
| Interquartile Range (IQR) | 1.1% | 3.2% |
| Standard Deviation (Sample) | 1.8% | 4.2% |
| Standard Deviation (Population) | 1.8% | 4.2% |
Similar Demographics by Female Unemployment
Demographics Similar to Immigrants from Southern Europe by Female Unemployment
In terms of female unemployment, the demographic groups most similar to Immigrants from Southern Europe are Immigrants from Morocco (5.3%, a difference of 0.070%), Laotian (5.3%, a difference of 0.070%), Immigrants from Laos (5.3%, a difference of 0.080%), Immigrants from Vietnam (5.3%, a difference of 0.080%), and Immigrants from Congo (5.3%, a difference of 0.19%).
| Demographics | Rating | Rank | Female Unemployment |
| Immigrants | Denmark | 55.0 /100 | #171 | Average 5.2% |
| Immigrants | Uganda | 50.7 /100 | #172 | Average 5.3% |
| Iranians | 50.4 /100 | #173 | Average 5.3% |
| Immigrants | Poland | 50.0 /100 | #174 | Average 5.3% |
| Immigrants | Laos | 47.5 /100 | #175 | Average 5.3% |
| Immigrants | Vietnam | 47.5 /100 | #176 | Average 5.3% |
| Immigrants | Morocco | 47.4 /100 | #177 | Average 5.3% |
| Immigrants | Southern Europe | 46.2 /100 | #178 | Average 5.3% |
| Laotians | 45.1 /100 | #179 | Average 5.3% |
| Immigrants | Congo | 43.1 /100 | #180 | Average 5.3% |
| Taiwanese | 42.7 /100 | #181 | Average 5.3% |
| Immigrants | Nonimmigrants | 42.6 /100 | #182 | Average 5.3% |
| Immigrants | Indonesia | 40.7 /100 | #183 | Average 5.3% |
| Immigrants | Ukraine | 40.1 /100 | #184 | Average 5.3% |
| Malaysians | 40.1 /100 | #185 | Average 5.3% |
Demographics Similar to Luxembourgers by Female Unemployment
In terms of female unemployment, the demographic groups most similar to Luxembourgers are Czech (4.4%, a difference of 0.010%), Danish (4.4%, a difference of 0.030%), Hmong (4.4%, a difference of 0.14%), Swedish (4.4%, a difference of 1.4%), and Chinese (4.5%, a difference of 2.2%).
| Demographics | Rating | Rank | Female Unemployment |
| Norwegians | 100.0 /100 | #1 | Exceptional 4.2% |
| Czechs | 100.0 /100 | #2 | Exceptional 4.4% |
| Luxembourgers | 100.0 /100 | #3 | Exceptional 4.4% |
| Danes | 100.0 /100 | #4 | Exceptional 4.4% |
| Hmong | 100.0 /100 | #5 | Exceptional 4.4% |
| Swedes | 100.0 /100 | #6 | Exceptional 4.4% |
| Chinese | 100.0 /100 | #7 | Exceptional 4.5% |
| Germans | 100.0 /100 | #8 | Exceptional 4.5% |
| Slovenes | 100.0 /100 | #9 | Exceptional 4.5% |
| Swiss | 100.0 /100 | #10 | Exceptional 4.6% |
| Scandinavians | 100.0 /100 | #11 | Exceptional 4.6% |
| Dutch | 100.0 /100 | #12 | Exceptional 4.6% |
| Belgians | 100.0 /100 | #13 | Exceptional 4.6% |
| Finns | 100.0 /100 | #14 | Exceptional 4.6% |
| English | 100.0 /100 | #15 | Exceptional 4.6% |