Immigrants from South Eastern Asia vs Immigrants from Syria Male Unemployment
COMPARE
Immigrants from South Eastern Asia
Immigrants from Syria
Male Unemployment
Male Unemployment Comparison
Immigrants from South Eastern Asia
Immigrants from Syria
5.4%
MALE UNEMPLOYMENT
28.2/ 100
METRIC RATING
191st/ 347
METRIC RANK
5.5%
MALE UNEMPLOYMENT
9.3/ 100
METRIC RATING
207th/ 347
METRIC RANK
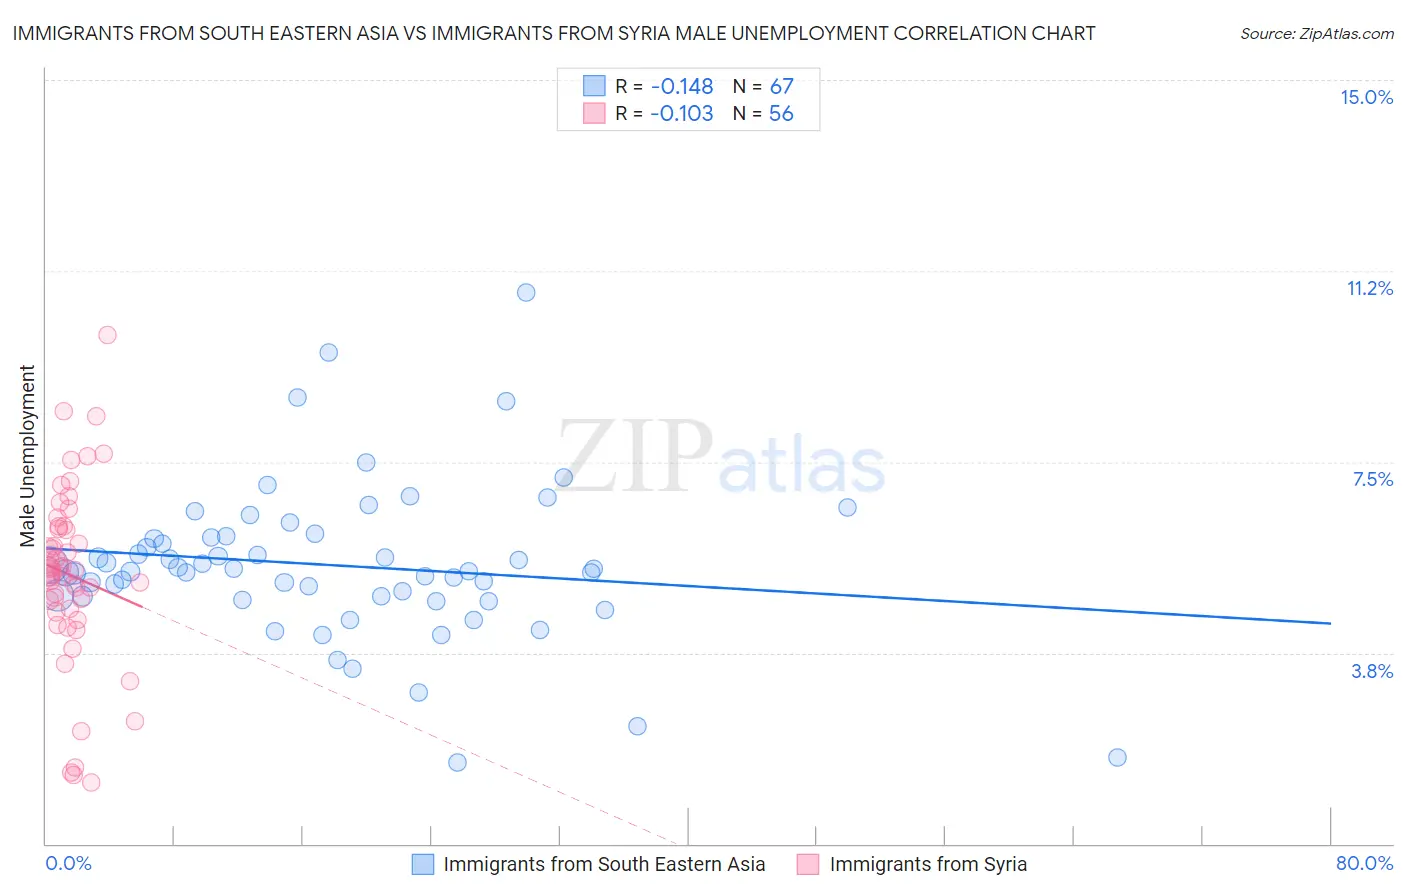
Immigrants from South Eastern Asia vs Immigrants from Syria Male Unemployment Correlation Chart
The statistical analysis conducted on geographies consisting of 508,417,377 people shows a poor negative correlation between the proportion of Immigrants from South Eastern Asia and unemployment rate among males in the United States with a correlation coefficient (R) of -0.148 and weighted average of 5.4%. Similarly, the statistical analysis conducted on geographies consisting of 173,829,424 people shows a poor negative correlation between the proportion of Immigrants from Syria and unemployment rate among males in the United States with a correlation coefficient (R) of -0.103 and weighted average of 5.5%, a difference of 1.9%.
Male Unemployment Correlation Summary
| Measurement | Immigrants from South Eastern Asia | Immigrants from Syria |
| Minimum | 1.6% | 1.2% |
| Maximum | 10.8% | 10.0% |
| Range | 9.2% | 8.8% |
| Mean | 5.5% | 5.3% |
| Median | 5.3% | 5.4% |
| Interquartile 25% (IQ1) | 4.9% | 4.6% |
| Interquartile 75% (IQ3) | 6.0% | 6.2% |
| Interquartile Range (IQR) | 1.2% | 1.6% |
| Standard Deviation (Sample) | 1.5% | 1.8% |
| Standard Deviation (Population) | 1.5% | 1.8% |
Demographics Similar to Immigrants from South Eastern Asia and Immigrants from Syria by Male Unemployment
In terms of male unemployment, the demographic groups most similar to Immigrants from South Eastern Asia are Immigrants from Uganda (5.4%, a difference of 0.040%), Immigrants from South America (5.4%, a difference of 0.080%), Immigrants from Belarus (5.4%, a difference of 0.16%), Immigrants from Israel (5.4%, a difference of 0.22%), and Spanish (5.4%, a difference of 0.68%). Similarly, the demographic groups most similar to Immigrants from Syria are Immigrants from Ukraine (5.5%, a difference of 0.10%), Immigrants from Lebanon (5.5%, a difference of 0.13%), Immigrants from Middle Africa (5.5%, a difference of 0.18%), Immigrants from Costa Rica (5.5%, a difference of 0.32%), and Guamanian/Chamorro (5.4%, a difference of 0.45%).
| Demographics | Rating | Rank | Male Unemployment |
| Immigrants | South America | 29.4 /100 | #189 | Fair 5.4% |
| Immigrants | Uganda | 28.8 /100 | #190 | Fair 5.4% |
| Immigrants | South Eastern Asia | 28.2 /100 | #191 | Fair 5.4% |
| Immigrants | Belarus | 26.0 /100 | #192 | Fair 5.4% |
| Immigrants | Israel | 25.2 /100 | #193 | Fair 5.4% |
| Spanish | 19.7 /100 | #194 | Poor 5.4% |
| Immigrants | Southern Europe | 17.7 /100 | #195 | Poor 5.4% |
| Albanians | 17.3 /100 | #196 | Poor 5.4% |
| Alsatians | 16.7 /100 | #197 | Poor 5.4% |
| Immigrants | Thailand | 14.7 /100 | #198 | Poor 5.4% |
| Immigrants | Greece | 14.5 /100 | #199 | Poor 5.4% |
| Immigrants | Zaire | 13.7 /100 | #200 | Poor 5.4% |
| Immigrants | Philippines | 13.5 /100 | #201 | Poor 5.4% |
| Immigrants | Nonimmigrants | 13.1 /100 | #202 | Poor 5.4% |
| Immigrants | Laos | 13.0 /100 | #203 | Poor 5.4% |
| Guamanians/Chamorros | 12.3 /100 | #204 | Poor 5.4% |
| Immigrants | Costa Rica | 11.4 /100 | #205 | Poor 5.5% |
| Immigrants | Ukraine | 9.9 /100 | #206 | Tragic 5.5% |
| Immigrants | Syria | 9.3 /100 | #207 | Tragic 5.5% |
| Immigrants | Lebanon | 8.6 /100 | #208 | Tragic 5.5% |
| Immigrants | Middle Africa | 8.3 /100 | #209 | Tragic 5.5% |