Native Hawaiian vs Immigrants from Syria Male Unemployment
COMPARE
Native Hawaiian
Immigrants from Syria
Male Unemployment
Male Unemployment Comparison
Native Hawaiians
Immigrants from Syria
5.6%
MALE UNEMPLOYMENT
1.1/ 100
METRIC RATING
238th/ 347
METRIC RANK
5.5%
MALE UNEMPLOYMENT
9.3/ 100
METRIC RATING
207th/ 347
METRIC RANK
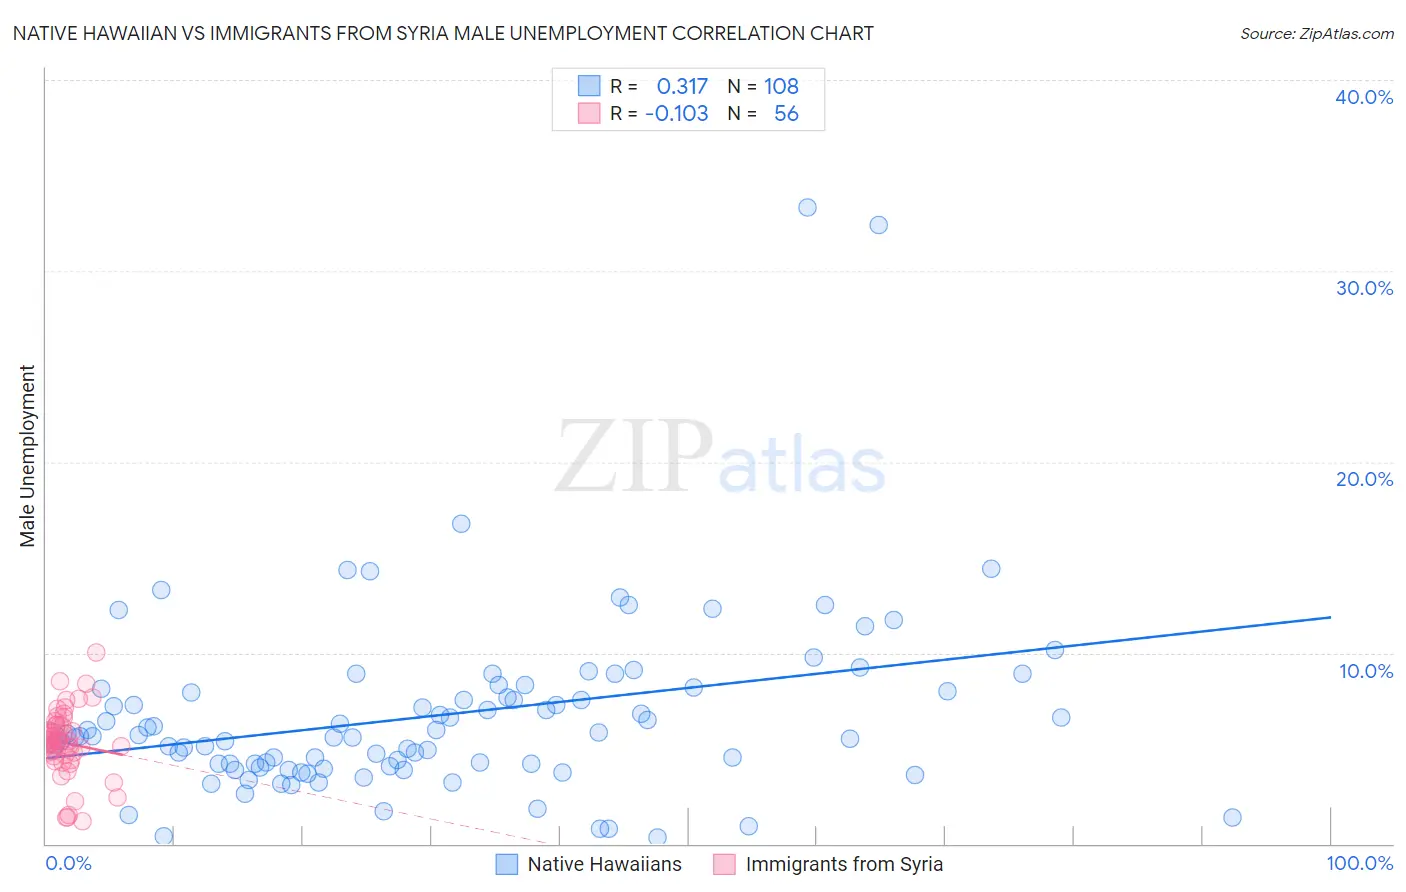
Native Hawaiian vs Immigrants from Syria Male Unemployment Correlation Chart
The statistical analysis conducted on geographies consisting of 330,837,635 people shows a mild positive correlation between the proportion of Native Hawaiians and unemployment rate among males in the United States with a correlation coefficient (R) of 0.317 and weighted average of 5.6%. Similarly, the statistical analysis conducted on geographies consisting of 173,829,424 people shows a poor negative correlation between the proportion of Immigrants from Syria and unemployment rate among males in the United States with a correlation coefficient (R) of -0.103 and weighted average of 5.5%, a difference of 3.2%.
Male Unemployment Correlation Summary
| Measurement | Native Hawaiian | Immigrants from Syria |
| Minimum | 0.30% | 1.2% |
| Maximum | 33.3% | 10.0% |
| Range | 33.0% | 8.8% |
| Mean | 6.7% | 5.3% |
| Median | 5.6% | 5.4% |
| Interquartile 25% (IQ1) | 4.1% | 4.6% |
| Interquartile 75% (IQ3) | 8.1% | 6.2% |
| Interquartile Range (IQR) | 4.0% | 1.6% |
| Standard Deviation (Sample) | 4.9% | 1.8% |
| Standard Deviation (Population) | 4.9% | 1.8% |
Similar Demographics by Male Unemployment
Demographics Similar to Native Hawaiians by Male Unemployment
In terms of male unemployment, the demographic groups most similar to Native Hawaiians are Immigrants from Guatemala (5.6%, a difference of 0.0%), Honduran (5.6%, a difference of 0.050%), Immigrants from Cameroon (5.6%, a difference of 0.070%), Salvadoran (5.7%, a difference of 0.12%), and Guatemalan (5.6%, a difference of 0.14%).
| Demographics | Rating | Rank | Male Unemployment |
| Choctaw | 1.6 /100 | #231 | Tragic 5.6% |
| Moroccans | 1.6 /100 | #232 | Tragic 5.6% |
| Somalis | 1.5 /100 | #233 | Tragic 5.6% |
| Immigrants | Somalia | 1.5 /100 | #234 | Tragic 5.6% |
| Immigrants | Honduras | 1.5 /100 | #235 | Tragic 5.6% |
| Guatemalans | 1.2 /100 | #236 | Tragic 5.6% |
| Hondurans | 1.1 /100 | #237 | Tragic 5.6% |
| Native Hawaiians | 1.1 /100 | #238 | Tragic 5.6% |
| Immigrants | Guatemala | 1.1 /100 | #239 | Tragic 5.6% |
| Immigrants | Cameroon | 1.0 /100 | #240 | Tragic 5.6% |
| Salvadorans | 1.0 /100 | #241 | Tragic 5.7% |
| Ottawa | 0.9 /100 | #242 | Tragic 5.7% |
| Bangladeshis | 0.8 /100 | #243 | Tragic 5.7% |
| Immigrants | El Salvador | 0.7 /100 | #244 | Tragic 5.7% |
| Yaqui | 0.7 /100 | #245 | Tragic 5.7% |
Demographics Similar to Immigrants from Syria by Male Unemployment
In terms of male unemployment, the demographic groups most similar to Immigrants from Syria are Immigrants from Ukraine (5.5%, a difference of 0.10%), Immigrants from Lebanon (5.5%, a difference of 0.13%), Immigrants from Middle Africa (5.5%, a difference of 0.18%), South American Indian (5.5%, a difference of 0.31%), and Immigrants from Costa Rica (5.5%, a difference of 0.32%).
| Demographics | Rating | Rank | Male Unemployment |
| Immigrants | Zaire | 13.7 /100 | #200 | Poor 5.4% |
| Immigrants | Philippines | 13.5 /100 | #201 | Poor 5.4% |
| Immigrants | Nonimmigrants | 13.1 /100 | #202 | Poor 5.4% |
| Immigrants | Laos | 13.0 /100 | #203 | Poor 5.4% |
| Guamanians/Chamorros | 12.3 /100 | #204 | Poor 5.4% |
| Immigrants | Costa Rica | 11.4 /100 | #205 | Poor 5.5% |
| Immigrants | Ukraine | 9.9 /100 | #206 | Tragic 5.5% |
| Immigrants | Syria | 9.3 /100 | #207 | Tragic 5.5% |
| Immigrants | Lebanon | 8.6 /100 | #208 | Tragic 5.5% |
| Immigrants | Middle Africa | 8.3 /100 | #209 | Tragic 5.5% |
| South American Indians | 7.6 /100 | #210 | Tragic 5.5% |
| Israelis | 7.4 /100 | #211 | Tragic 5.5% |
| Hmong | 7.0 /100 | #212 | Tragic 5.5% |
| Ugandans | 6.3 /100 | #213 | Tragic 5.5% |
| Puget Sound Salish | 5.6 /100 | #214 | Tragic 5.5% |