British vs Honduran Unemployment Among Ages 60 to 64 years
COMPARE
British
Honduran
Unemployment Among Ages 60 to 64 years
Unemployment Among Ages 60 to 64 years Comparison
British
Hondurans
4.6%
UNEMPLOYMENT AMONG AGES 60 TO 64 YEARS
99.9/ 100
METRIC RATING
57th/ 347
METRIC RANK
5.1%
UNEMPLOYMENT AMONG AGES 60 TO 64 YEARS
0.5/ 100
METRIC RATING
259th/ 347
METRIC RANK
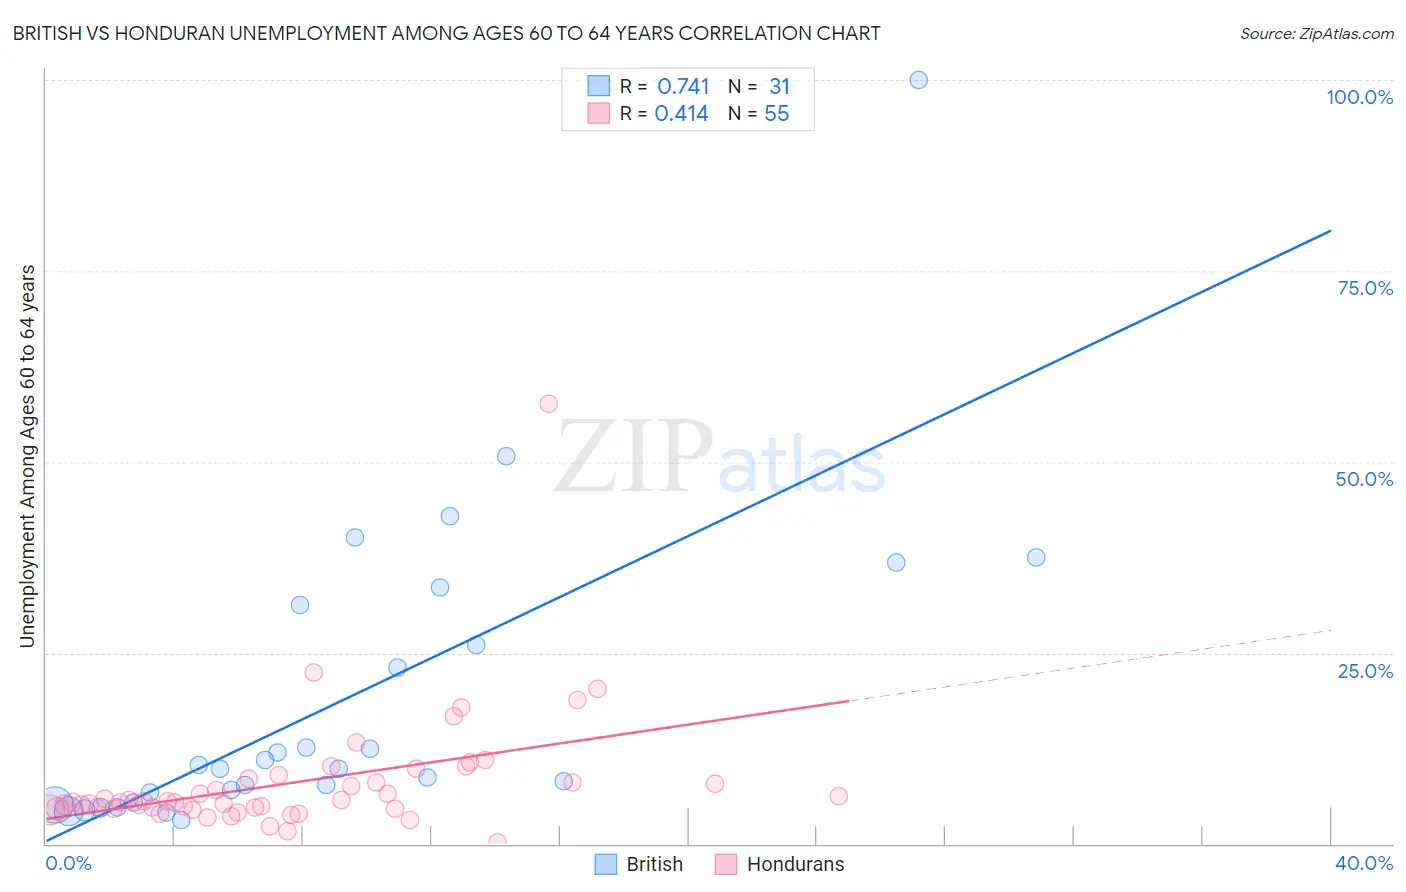
British vs Honduran Unemployment Among Ages 60 to 64 years Correlation Chart
The statistical analysis conducted on geographies consisting of 446,607,346 people shows a strong positive correlation between the proportion of British and unemployment rate among population between the ages 60 and 64 in the United States with a correlation coefficient (R) of 0.741 and weighted average of 4.6%. Similarly, the statistical analysis conducted on geographies consisting of 328,377,700 people shows a moderate positive correlation between the proportion of Hondurans and unemployment rate among population between the ages 60 and 64 in the United States with a correlation coefficient (R) of 0.414 and weighted average of 5.1%, a difference of 11.1%.
Unemployment Among Ages 60 to 64 years Correlation Summary
| Measurement | British | Honduran |
| Minimum | 3.1% | 0.20% |
| Maximum | 100.0% | 57.6% |
| Range | 96.9% | 57.4% |
| Mean | 18.8% | 8.0% |
| Median | 9.9% | 5.4% |
| Interquartile 25% (IQ1) | 5.5% | 4.5% |
| Interquartile 75% (IQ3) | 31.3% | 8.4% |
| Interquartile Range (IQR) | 25.8% | 3.9% |
| Standard Deviation (Sample) | 20.5% | 8.2% |
| Standard Deviation (Population) | 20.1% | 8.1% |
Similar Demographics by Unemployment Among Ages 60 to 64 years
Demographics Similar to British by Unemployment Among Ages 60 to 64 years
In terms of unemployment among ages 60 to 64 years, the demographic groups most similar to British are Welsh (4.6%, a difference of 0.010%), Immigrants from India (4.6%, a difference of 0.050%), Bangladeshi (4.6%, a difference of 0.10%), Dutch (4.6%, a difference of 0.12%), and Immigrants from Moldova (4.6%, a difference of 0.15%).
| Demographics | Rating | Rank | Unemployment Among Ages 60 to 64 years |
| Scottish | 99.9 /100 | #50 | Exceptional 4.6% |
| Immigrants | Kenya | 99.9 /100 | #51 | Exceptional 4.6% |
| Kenyans | 99.9 /100 | #52 | Exceptional 4.6% |
| Immigrants | Moldova | 99.9 /100 | #53 | Exceptional 4.6% |
| Dutch | 99.9 /100 | #54 | Exceptional 4.6% |
| Bangladeshis | 99.9 /100 | #55 | Exceptional 4.6% |
| Welsh | 99.9 /100 | #56 | Exceptional 4.6% |
| British | 99.9 /100 | #57 | Exceptional 4.6% |
| Immigrants | India | 99.8 /100 | #58 | Exceptional 4.6% |
| Swiss | 99.8 /100 | #59 | Exceptional 4.6% |
| Puget Sound Salish | 99.8 /100 | #60 | Exceptional 4.6% |
| Lebanese | 99.8 /100 | #61 | Exceptional 4.6% |
| Senegalese | 99.7 /100 | #62 | Exceptional 4.6% |
| Czechoslovakians | 99.7 /100 | #63 | Exceptional 4.6% |
| Immigrants | Middle Africa | 99.7 /100 | #64 | Exceptional 4.6% |
Demographics Similar to Hondurans by Unemployment Among Ages 60 to 64 years
In terms of unemployment among ages 60 to 64 years, the demographic groups most similar to Hondurans are Celtic (5.1%, a difference of 0.010%), Immigrants from Honduras (5.1%, a difference of 0.13%), Japanese (5.1%, a difference of 0.17%), Immigrants from Ghana (5.1%, a difference of 0.23%), and Immigrants from Uzbekistan (5.1%, a difference of 0.25%).
| Demographics | Rating | Rank | Unemployment Among Ages 60 to 64 years |
| Immigrants | Switzerland | 0.9 /100 | #252 | Tragic 5.1% |
| Immigrants | China | 0.9 /100 | #253 | Tragic 5.1% |
| Costa Ricans | 0.8 /100 | #254 | Tragic 5.1% |
| Estonians | 0.8 /100 | #255 | Tragic 5.1% |
| Immigrants | Peru | 0.7 /100 | #256 | Tragic 5.1% |
| Japanese | 0.6 /100 | #257 | Tragic 5.1% |
| Celtics | 0.5 /100 | #258 | Tragic 5.1% |
| Hondurans | 0.5 /100 | #259 | Tragic 5.1% |
| Immigrants | Honduras | 0.4 /100 | #260 | Tragic 5.1% |
| Immigrants | Ghana | 0.4 /100 | #261 | Tragic 5.1% |
| Immigrants | Uzbekistan | 0.4 /100 | #262 | Tragic 5.1% |
| Immigrants | Immigrants | 0.4 /100 | #263 | Tragic 5.1% |
| Sioux | 0.3 /100 | #264 | Tragic 5.1% |
| Immigrants | Argentina | 0.2 /100 | #265 | Tragic 5.1% |
| Immigrants | Australia | 0.2 /100 | #266 | Tragic 5.1% |