Immigrants from South Central Asia vs Ghanaian Unemployment Among Women with Children Ages 6 to 17 years
COMPARE
Immigrants from South Central Asia
Ghanaian
Unemployment Among Women with Children Ages 6 to 17 years
Unemployment Among Women with Children Ages 6 to 17 years Comparison
Immigrants from South Central Asia
Ghanaians
7.9%
UNEMPLOYMENT AMONG WOMEN WITH CHILDREN AGES 6 TO 17 YEARS
100.0/ 100
METRIC RATING
35th/ 347
METRIC RANK
9.6%
UNEMPLOYMENT AMONG WOMEN WITH CHILDREN AGES 6 TO 17 YEARS
0.2/ 100
METRIC RATING
268th/ 347
METRIC RANK
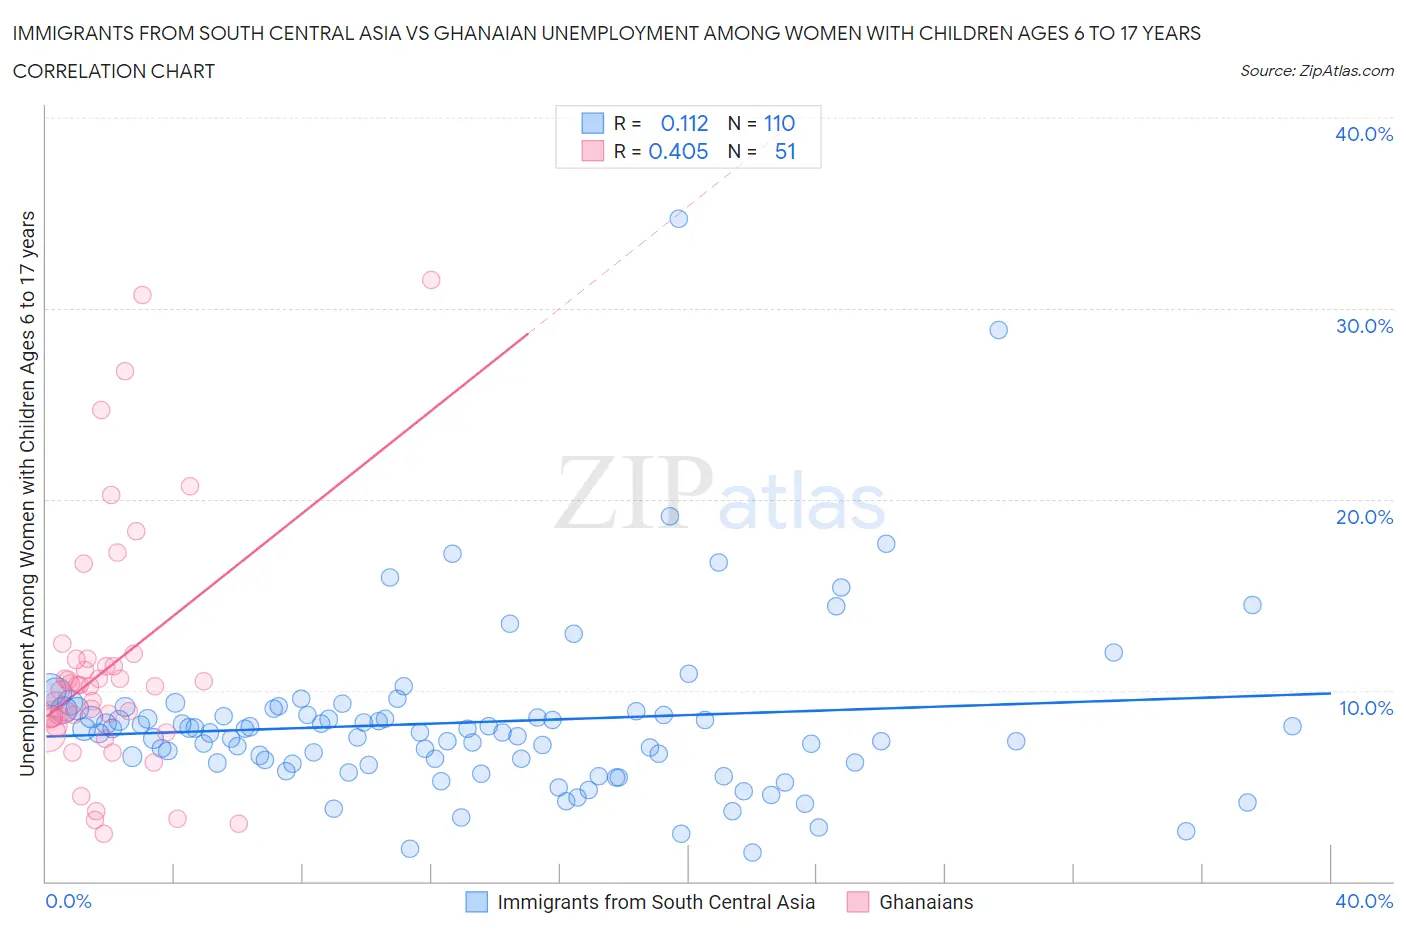
Immigrants from South Central Asia vs Ghanaian Unemployment Among Women with Children Ages 6 to 17 years Correlation Chart
The statistical analysis conducted on geographies consisting of 326,255,607 people shows a poor positive correlation between the proportion of Immigrants from South Central Asia and unemployment rate among women with children between the ages 6 and 17 in the United States with a correlation coefficient (R) of 0.112 and weighted average of 7.9%. Similarly, the statistical analysis conducted on geographies consisting of 158,398,422 people shows a moderate positive correlation between the proportion of Ghanaians and unemployment rate among women with children between the ages 6 and 17 in the United States with a correlation coefficient (R) of 0.405 and weighted average of 9.6%, a difference of 20.4%.
Unemployment Among Women with Children Ages 6 to 17 years Correlation Summary
| Measurement | Immigrants from South Central Asia | Ghanaian |
| Minimum | 1.5% | 2.5% |
| Maximum | 34.7% | 31.5% |
| Range | 33.2% | 29.0% |
| Mean | 8.3% | 11.2% |
| Median | 7.8% | 10.2% |
| Interquartile 25% (IQ1) | 6.2% | 8.1% |
| Interquartile 75% (IQ3) | 8.9% | 11.6% |
| Interquartile Range (IQR) | 2.7% | 3.5% |
| Standard Deviation (Sample) | 4.5% | 6.4% |
| Standard Deviation (Population) | 4.5% | 6.3% |
Similar Demographics by Unemployment Among Women with Children Ages 6 to 17 years
Demographics Similar to Immigrants from South Central Asia by Unemployment Among Women with Children Ages 6 to 17 years
In terms of unemployment among women with children ages 6 to 17 years, the demographic groups most similar to Immigrants from South Central Asia are Burmese (8.0%, a difference of 0.080%), Native Hawaiian (7.9%, a difference of 0.11%), Asian (8.0%, a difference of 0.11%), Immigrants from Korea (7.9%, a difference of 0.39%), and Immigrants from Cambodia (7.9%, a difference of 0.44%).
| Demographics | Rating | Rank | Unemployment Among Women with Children Ages 6 to 17 years |
| Immigrants | Uzbekistan | 100.0 /100 | #28 | Exceptional 7.8% |
| Thais | 100.0 /100 | #29 | Exceptional 7.8% |
| Immigrants | Iran | 100.0 /100 | #30 | Exceptional 7.9% |
| Laotians | 100.0 /100 | #31 | Exceptional 7.9% |
| Immigrants | Cambodia | 100.0 /100 | #32 | Exceptional 7.9% |
| Immigrants | Korea | 100.0 /100 | #33 | Exceptional 7.9% |
| Native Hawaiians | 100.0 /100 | #34 | Exceptional 7.9% |
| Immigrants | South Central Asia | 100.0 /100 | #35 | Exceptional 7.9% |
| Burmese | 100.0 /100 | #36 | Exceptional 8.0% |
| Asians | 100.0 /100 | #37 | Exceptional 8.0% |
| Alsatians | 100.0 /100 | #38 | Exceptional 8.0% |
| Somalis | 100.0 /100 | #39 | Exceptional 8.0% |
| Immigrants | Zimbabwe | 100.0 /100 | #40 | Exceptional 8.0% |
| Iranians | 100.0 /100 | #41 | Exceptional 8.0% |
| Immigrants | Somalia | 100.0 /100 | #42 | Exceptional 8.0% |
Demographics Similar to Ghanaians by Unemployment Among Women with Children Ages 6 to 17 years
In terms of unemployment among women with children ages 6 to 17 years, the demographic groups most similar to Ghanaians are Blackfeet (9.6%, a difference of 0.080%), Immigrants from Nicaragua (9.6%, a difference of 0.18%), Irish (9.5%, a difference of 0.39%), Immigrants from Jamaica (9.5%, a difference of 0.41%), and West Indian (9.5%, a difference of 0.57%).
| Demographics | Rating | Rank | Unemployment Among Women with Children Ages 6 to 17 years |
| South Americans | 0.5 /100 | #261 | Tragic 9.5% |
| Senegalese | 0.5 /100 | #262 | Tragic 9.5% |
| Lebanese | 0.5 /100 | #263 | Tragic 9.5% |
| Immigrants | Ghana | 0.4 /100 | #264 | Tragic 9.5% |
| West Indians | 0.4 /100 | #265 | Tragic 9.5% |
| Immigrants | Jamaica | 0.3 /100 | #266 | Tragic 9.5% |
| Irish | 0.3 /100 | #267 | Tragic 9.5% |
| Ghanaians | 0.2 /100 | #268 | Tragic 9.6% |
| Blackfeet | 0.2 /100 | #269 | Tragic 9.6% |
| Immigrants | Nicaragua | 0.2 /100 | #270 | Tragic 9.6% |
| Immigrants | Latin America | 0.1 /100 | #271 | Tragic 9.6% |
| Kiowa | 0.1 /100 | #272 | Tragic 9.6% |
| Whites/Caucasians | 0.1 /100 | #273 | Tragic 9.6% |
| Aleuts | 0.1 /100 | #274 | Tragic 9.6% |
| U.S. Virgin Islanders | 0.1 /100 | #275 | Tragic 9.7% |