Hopi vs Ecuadorian Unemployment Among Women with Children Under 6 years
COMPARE
Hopi
Ecuadorian
Unemployment Among Women with Children Under 6 years
Unemployment Among Women with Children Under 6 years Comparison
Hopi
Ecuadorians
16.8%
UNEMPLOYMENT AMONG WOMEN WITH CHILDREN UNDER 6 YEARS
0.0/ 100
METRIC RATING
344th/ 347
METRIC RANK
7.9%
UNEMPLOYMENT AMONG WOMEN WITH CHILDREN UNDER 6 YEARS
11.2/ 100
METRIC RATING
215th/ 347
METRIC RANK
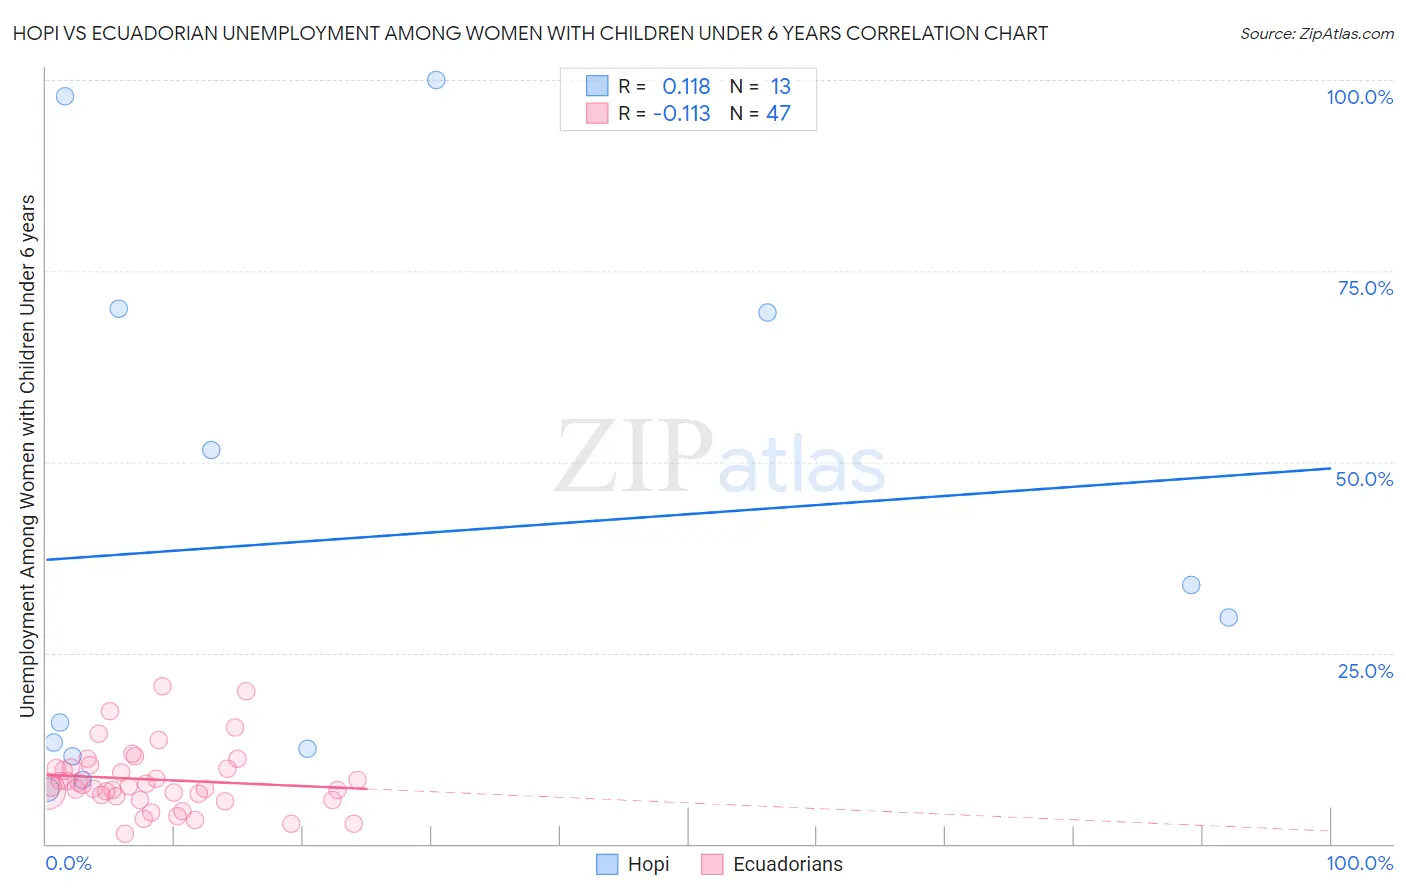
Hopi vs Ecuadorian Unemployment Among Women with Children Under 6 years Correlation Chart
The statistical analysis conducted on geographies consisting of 69,549,010 people shows a poor positive correlation between the proportion of Hopi and unemployment rate among women with children under the age of 6 in the United States with a correlation coefficient (R) of 0.118 and weighted average of 16.8%. Similarly, the statistical analysis conducted on geographies consisting of 256,319,912 people shows a poor negative correlation between the proportion of Ecuadorians and unemployment rate among women with children under the age of 6 in the United States with a correlation coefficient (R) of -0.113 and weighted average of 7.9%, a difference of 112.1%.
Unemployment Among Women with Children Under 6 years Correlation Summary
| Measurement | Hopi | Ecuadorian |
| Minimum | 7.0% | 1.3% |
| Maximum | 100.0% | 20.7% |
| Range | 93.0% | 19.4% |
| Mean | 40.1% | 8.4% |
| Median | 29.7% | 7.6% |
| Interquartile 25% (IQ1) | 12.0% | 6.3% |
| Interquartile 75% (IQ3) | 69.8% | 10.0% |
| Interquartile Range (IQR) | 57.8% | 3.7% |
| Standard Deviation (Sample) | 34.1% | 4.2% |
| Standard Deviation (Population) | 32.8% | 4.1% |
Similar Demographics by Unemployment Among Women with Children Under 6 years
Demographics Similar to Hopi by Unemployment Among Women with Children Under 6 years
In terms of unemployment among women with children under 6 years, the demographic groups most similar to Hopi are Inupiat (17.7%, a difference of 5.6%), Arapaho (19.0%, a difference of 13.5%), Crow (14.6%, a difference of 14.6%), Yuman (14.6%, a difference of 14.7%), and Lumbee (13.8%, a difference of 21.6%).
| Demographics | Rating | Rank | Unemployment Among Women with Children Under 6 years |
| Natives/Alaskans | 0.0 /100 | #333 | Tragic 11.5% |
| Apache | 0.0 /100 | #334 | Tragic 12.3% |
| Puerto Ricans | 0.0 /100 | #335 | Tragic 12.5% |
| Shoshone | 0.0 /100 | #336 | Tragic 13.2% |
| Chippewa | 0.0 /100 | #337 | Tragic 13.3% |
| Pima | 0.0 /100 | #338 | Tragic 13.4% |
| Navajo | 0.0 /100 | #339 | Tragic 13.5% |
| Immigrants | Yemen | 0.0 /100 | #340 | Tragic 13.5% |
| Lumbee | 0.0 /100 | #341 | Tragic 13.8% |
| Yuman | 0.0 /100 | #342 | Tragic 14.6% |
| Crow | 0.0 /100 | #343 | Tragic 14.6% |
| Hopi | 0.0 /100 | #344 | Tragic 16.8% |
| Inupiat | 0.0 /100 | #345 | Tragic 17.7% |
| Arapaho | 0.0 /100 | #346 | Tragic 19.0% |
| Yup'ik | 0.0 /100 | #347 | Tragic 21.1% |
Demographics Similar to Ecuadorians by Unemployment Among Women with Children Under 6 years
In terms of unemployment among women with children under 6 years, the demographic groups most similar to Ecuadorians are Spanish (7.9%, a difference of 0.010%), Immigrants from Lebanon (7.9%, a difference of 0.020%), Scottish (7.9%, a difference of 0.040%), Immigrants from Nigeria (7.9%, a difference of 0.14%), and Swiss (7.9%, a difference of 0.17%).
| Demographics | Rating | Rank | Unemployment Among Women with Children Under 6 years |
| Immigrants | Syria | 18.9 /100 | #208 | Poor 7.8% |
| Costa Ricans | 17.6 /100 | #209 | Poor 7.8% |
| Poles | 16.0 /100 | #210 | Poor 7.9% |
| Immigrants | Ecuador | 14.9 /100 | #211 | Poor 7.9% |
| Swiss | 12.3 /100 | #212 | Poor 7.9% |
| Scottish | 11.4 /100 | #213 | Poor 7.9% |
| Spanish | 11.3 /100 | #214 | Poor 7.9% |
| Ecuadorians | 11.2 /100 | #215 | Poor 7.9% |
| Immigrants | Lebanon | 11.1 /100 | #216 | Poor 7.9% |
| Immigrants | Nigeria | 10.3 /100 | #217 | Poor 7.9% |
| Moroccans | 9.7 /100 | #218 | Tragic 7.9% |
| Arabs | 9.4 /100 | #219 | Tragic 7.9% |
| South American Indians | 9.3 /100 | #220 | Tragic 7.9% |
| Immigrants | Germany | 8.5 /100 | #221 | Tragic 7.9% |
| Samoans | 8.4 /100 | #222 | Tragic 7.9% |