Immigrants from Bahamas vs Immigrants from South Eastern Asia Unemployment Among Seniors over 65 years
COMPARE
Immigrants from Bahamas
Immigrants from South Eastern Asia
Unemployment Among Seniors over 65 years
Unemployment Among Seniors over 65 years Comparison
Immigrants from Bahamas
Immigrants from South Eastern Asia
5.7%
UNEMPLOYMENT AMONG SENIORS OVER 65 YEARS
0.0/ 100
METRIC RATING
317th/ 347
METRIC RANK
5.1%
UNEMPLOYMENT AMONG SENIORS OVER 65 YEARS
65.6/ 100
METRIC RATING
162nd/ 347
METRIC RANK
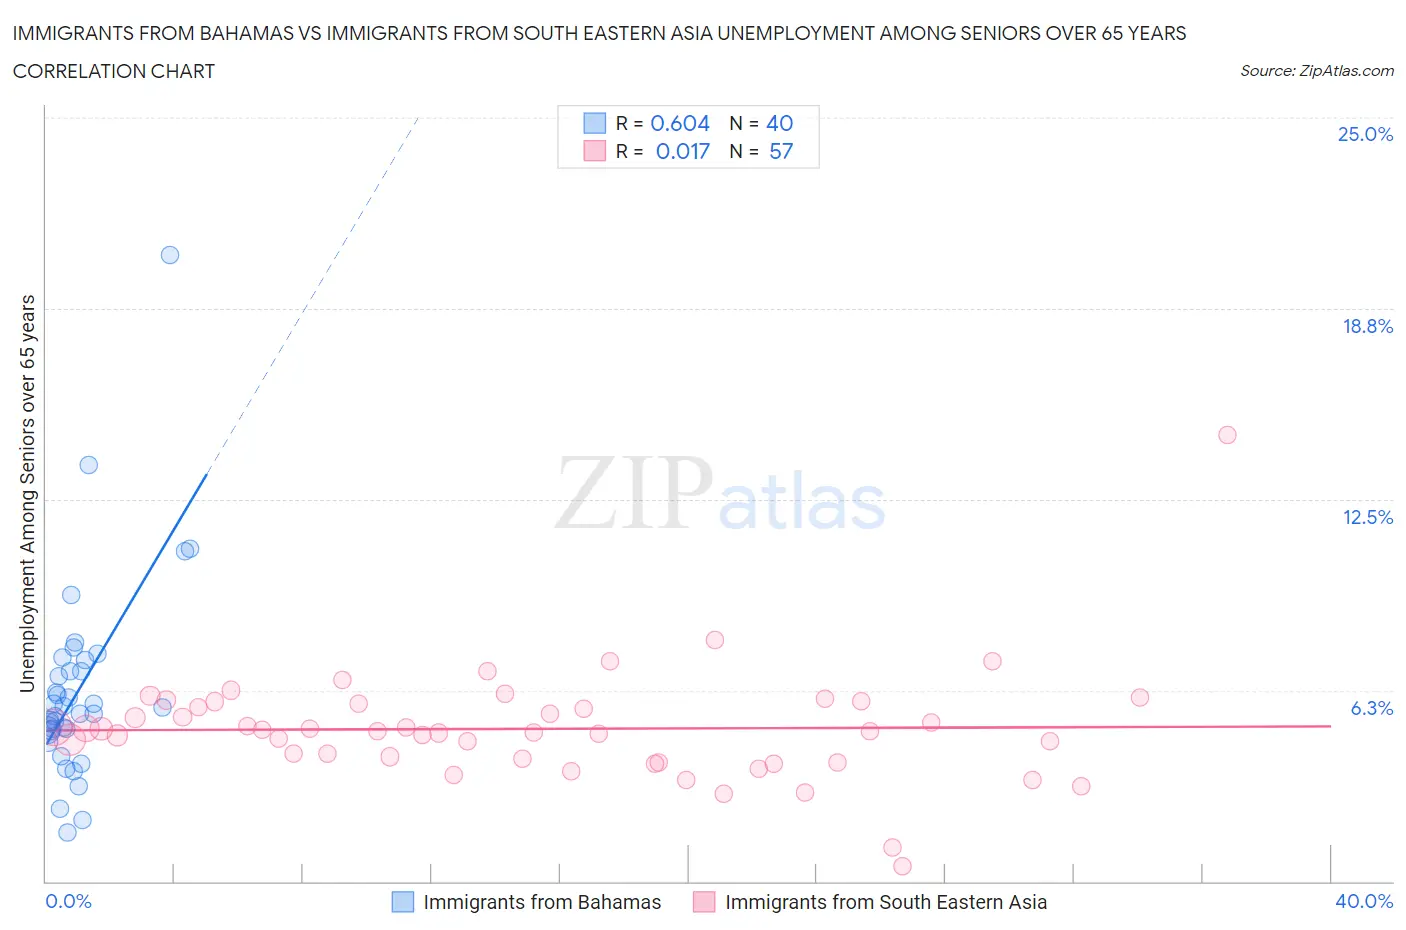
Immigrants from Bahamas vs Immigrants from South Eastern Asia Unemployment Among Seniors over 65 years Correlation Chart
The statistical analysis conducted on geographies consisting of 101,010,800 people shows a significant positive correlation between the proportion of Immigrants from Bahamas and unemployment rate amomg seniors over the age of 65 in the United States with a correlation coefficient (R) of 0.604 and weighted average of 5.7%. Similarly, the statistical analysis conducted on geographies consisting of 438,289,395 people shows no correlation between the proportion of Immigrants from South Eastern Asia and unemployment rate amomg seniors over the age of 65 in the United States with a correlation coefficient (R) of 0.017 and weighted average of 5.1%, a difference of 11.1%.
Unemployment Among Seniors over 65 years Correlation Summary
| Measurement | Immigrants from Bahamas | Immigrants from South Eastern Asia |
| Minimum | 1.6% | 0.50% |
| Maximum | 20.5% | 14.6% |
| Range | 18.9% | 14.1% |
| Mean | 6.3% | 5.0% |
| Median | 5.6% | 4.9% |
| Interquartile 25% (IQ1) | 4.9% | 3.9% |
| Interquartile 75% (IQ3) | 7.1% | 5.8% |
| Interquartile Range (IQR) | 2.1% | 1.9% |
| Standard Deviation (Sample) | 3.3% | 1.9% |
| Standard Deviation (Population) | 3.3% | 1.9% |
Similar Demographics by Unemployment Among Seniors over 65 years
Demographics Similar to Immigrants from Bahamas by Unemployment Among Seniors over 65 years
In terms of unemployment among seniors over 65 years, the demographic groups most similar to Immigrants from Bahamas are Immigrants from Central America (5.7%, a difference of 0.12%), Immigrants from El Salvador (5.7%, a difference of 0.30%), Vietnamese (5.7%, a difference of 0.32%), Delaware (5.7%, a difference of 0.34%), and Immigrants from Bangladesh (5.7%, a difference of 0.54%).
| Demographics | Rating | Rank | Unemployment Among Seniors over 65 years |
| Salvadorans | 0.0 /100 | #310 | Tragic 5.6% |
| Immigrants | Guyana | 0.0 /100 | #311 | Tragic 5.6% |
| Immigrants | Ecuador | 0.0 /100 | #312 | Tragic 5.6% |
| Barbadians | 0.0 /100 | #313 | Tragic 5.6% |
| Delaware | 0.0 /100 | #314 | Tragic 5.7% |
| Immigrants | El Salvador | 0.0 /100 | #315 | Tragic 5.7% |
| Immigrants | Central America | 0.0 /100 | #316 | Tragic 5.7% |
| Immigrants | Bahamas | 0.0 /100 | #317 | Tragic 5.7% |
| Vietnamese | 0.0 /100 | #318 | Tragic 5.7% |
| Immigrants | Bangladesh | 0.0 /100 | #319 | Tragic 5.7% |
| Immigrants | Mexico | 0.0 /100 | #320 | Tragic 5.7% |
| British West Indians | 0.0 /100 | #321 | Tragic 5.8% |
| Natives/Alaskans | 0.0 /100 | #322 | Tragic 5.8% |
| Immigrants | Dominica | 0.0 /100 | #323 | Tragic 5.8% |
| Yuman | 0.0 /100 | #324 | Tragic 5.8% |
Demographics Similar to Immigrants from South Eastern Asia by Unemployment Among Seniors over 65 years
In terms of unemployment among seniors over 65 years, the demographic groups most similar to Immigrants from South Eastern Asia are Immigrants from Bosnia and Herzegovina (5.1%, a difference of 0.020%), Potawatomi (5.1%, a difference of 0.040%), Nepalese (5.1%, a difference of 0.040%), Immigrants from Ukraine (5.1%, a difference of 0.050%), and Immigrants from Laos (5.1%, a difference of 0.060%).
| Demographics | Rating | Rank | Unemployment Among Seniors over 65 years |
| Basques | 72.9 /100 | #155 | Good 5.1% |
| Immigrants | Romania | 72.4 /100 | #156 | Good 5.1% |
| Immigrants | Northern Europe | 69.8 /100 | #157 | Good 5.1% |
| Immigrants | Belarus | 69.0 /100 | #158 | Good 5.1% |
| Immigrants | France | 68.6 /100 | #159 | Good 5.1% |
| French | 68.1 /100 | #160 | Good 5.1% |
| Immigrants | Bosnia and Herzegovina | 66.1 /100 | #161 | Good 5.1% |
| Immigrants | South Eastern Asia | 65.6 /100 | #162 | Good 5.1% |
| Potawatomi | 64.5 /100 | #163 | Good 5.1% |
| Nepalese | 64.5 /100 | #164 | Good 5.1% |
| Immigrants | Ukraine | 64.2 /100 | #165 | Good 5.1% |
| Immigrants | Laos | 63.8 /100 | #166 | Good 5.1% |
| Immigrants | Western Europe | 60.4 /100 | #167 | Good 5.1% |
| Mongolians | 59.8 /100 | #168 | Average 5.1% |
| Lithuanians | 58.2 /100 | #169 | Average 5.1% |