Immigrants from Senegal vs Egyptian Unemployment Among Youth under 25 years
COMPARE
Immigrants from Senegal
Egyptian
Unemployment Among Youth under 25 years
Unemployment Among Youth under 25 years Comparison
Immigrants from Senegal
Egyptians
13.8%
UNEMPLOYMENT AMONG YOUTH UNDER 25 YEARS
0.0/ 100
METRIC RATING
301st/ 347
METRIC RANK
11.7%
UNEMPLOYMENT AMONG YOUTH UNDER 25 YEARS
26.9/ 100
METRIC RATING
196th/ 347
METRIC RANK
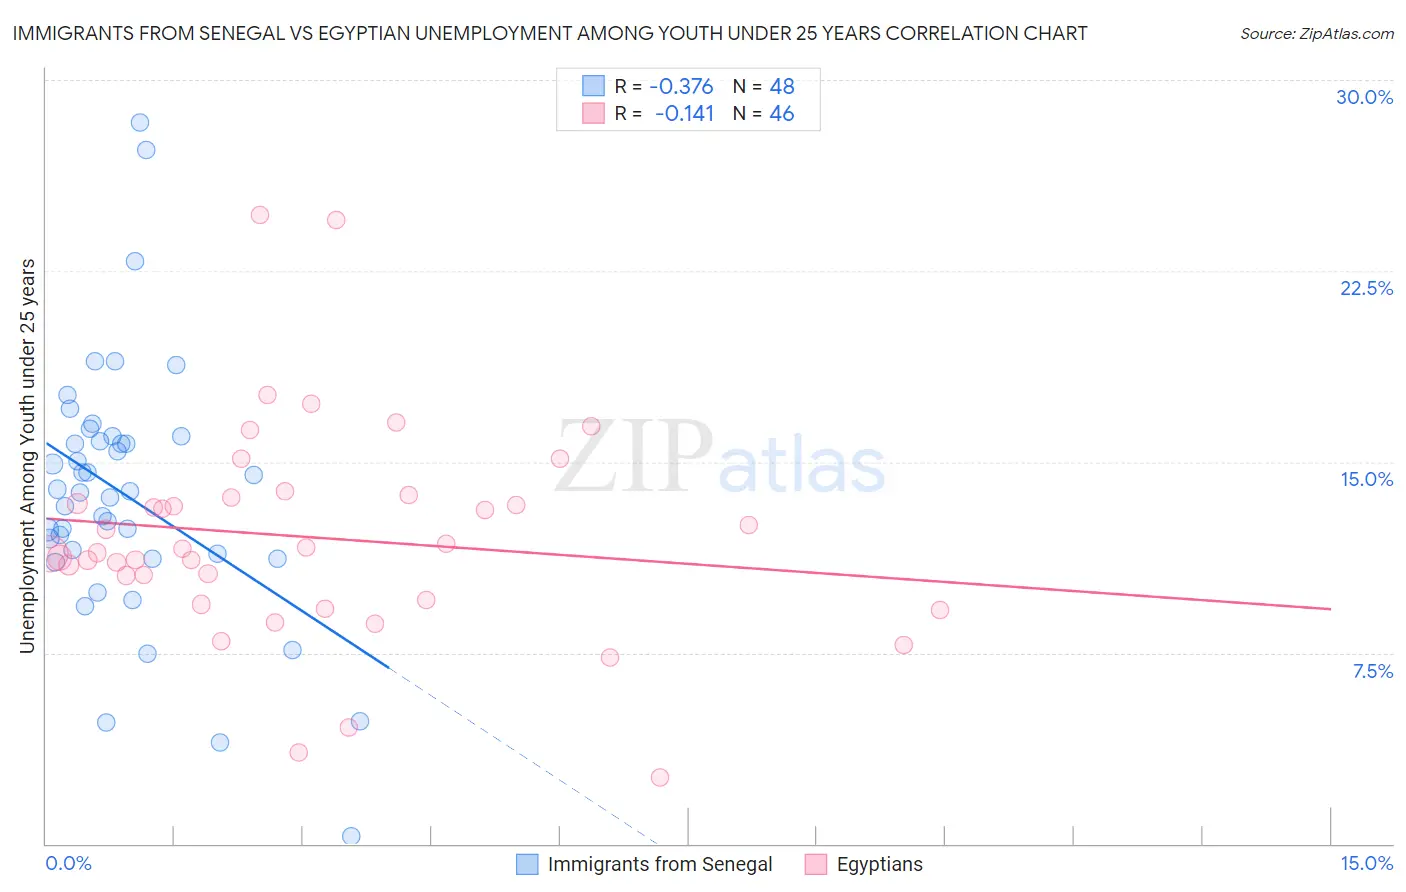
Immigrants from Senegal vs Egyptian Unemployment Among Youth under 25 years Correlation Chart
The statistical analysis conducted on geographies consisting of 90,014,443 people shows a mild negative correlation between the proportion of Immigrants from Senegal and unemployment rate among youth under the age of 25 in the United States with a correlation coefficient (R) of -0.376 and weighted average of 13.8%. Similarly, the statistical analysis conducted on geographies consisting of 275,376,024 people shows a poor negative correlation between the proportion of Egyptians and unemployment rate among youth under the age of 25 in the United States with a correlation coefficient (R) of -0.141 and weighted average of 11.7%, a difference of 17.9%.
Unemployment Among Youth under 25 years Correlation Summary
| Measurement | Immigrants from Senegal | Egyptian |
| Minimum | 0.30% | 2.6% |
| Maximum | 28.3% | 24.7% |
| Range | 28.0% | 22.1% |
| Mean | 13.7% | 12.0% |
| Median | 13.8% | 11.5% |
| Interquartile 25% (IQ1) | 11.3% | 9.6% |
| Interquartile 75% (IQ3) | 15.9% | 13.6% |
| Interquartile Range (IQR) | 4.6% | 4.0% |
| Standard Deviation (Sample) | 5.1% | 4.2% |
| Standard Deviation (Population) | 5.1% | 4.2% |
Similar Demographics by Unemployment Among Youth under 25 years
Demographics Similar to Immigrants from Senegal by Unemployment Among Youth under 25 years
In terms of unemployment among youth under 25 years, the demographic groups most similar to Immigrants from Senegal are Immigrants from Sierra Leone (13.8%, a difference of 0.050%), Belizean (13.8%, a difference of 0.080%), Houma (13.8%, a difference of 0.090%), Immigrants from Cabo Verde (13.8%, a difference of 0.17%), and Tohono O'odham (13.8%, a difference of 0.38%).
| Demographics | Rating | Rank | Unemployment Among Youth under 25 years |
| Immigrants | Caribbean | 0.0 /100 | #294 | Tragic 13.5% |
| Chippewa | 0.0 /100 | #295 | Tragic 13.5% |
| Senegalese | 0.0 /100 | #296 | Tragic 13.5% |
| U.S. Virgin Islanders | 0.0 /100 | #297 | Tragic 13.6% |
| Shoshone | 0.0 /100 | #298 | Tragic 13.7% |
| Tohono O'odham | 0.0 /100 | #299 | Tragic 13.8% |
| Immigrants | Cabo Verde | 0.0 /100 | #300 | Tragic 13.8% |
| Immigrants | Senegal | 0.0 /100 | #301 | Tragic 13.8% |
| Immigrants | Sierra Leone | 0.0 /100 | #302 | Tragic 13.8% |
| Belizeans | 0.0 /100 | #303 | Tragic 13.8% |
| Houma | 0.0 /100 | #304 | Tragic 13.8% |
| Haitians | 0.0 /100 | #305 | Tragic 13.9% |
| Pueblo | 0.0 /100 | #306 | Tragic 13.9% |
| Immigrants | Haiti | 0.0 /100 | #307 | Tragic 14.0% |
| Immigrants | Belize | 0.0 /100 | #308 | Tragic 14.0% |
Demographics Similar to Egyptians by Unemployment Among Youth under 25 years
In terms of unemployment among youth under 25 years, the demographic groups most similar to Egyptians are Paraguayan (11.7%, a difference of 0.010%), Seminole (11.7%, a difference of 0.050%), Immigrants from Sri Lanka (11.7%, a difference of 0.050%), Cypriot (11.7%, a difference of 0.080%), and Immigrants from Russia (11.7%, a difference of 0.080%).
| Demographics | Rating | Rank | Unemployment Among Youth under 25 years |
| Japanese | 30.8 /100 | #189 | Fair 11.7% |
| Portuguese | 30.3 /100 | #190 | Fair 11.7% |
| Cypriots | 28.5 /100 | #191 | Fair 11.7% |
| Immigrants | Russia | 28.5 /100 | #192 | Fair 11.7% |
| Seminole | 27.9 /100 | #193 | Fair 11.7% |
| Immigrants | Sri Lanka | 27.8 /100 | #194 | Fair 11.7% |
| Paraguayans | 27.2 /100 | #195 | Fair 11.7% |
| Egyptians | 26.9 /100 | #196 | Fair 11.7% |
| Koreans | 23.9 /100 | #197 | Fair 11.7% |
| Cherokee | 21.2 /100 | #198 | Fair 11.8% |
| Immigrants | Colombia | 20.9 /100 | #199 | Fair 11.8% |
| Arabs | 18.0 /100 | #200 | Poor 11.8% |
| Palestinians | 16.0 /100 | #201 | Poor 11.8% |
| Marshallese | 15.8 /100 | #202 | Poor 11.8% |
| Immigrants | Peru | 15.3 /100 | #203 | Poor 11.8% |