Indian (Asian) vs Immigrants from Cuba Unemployment Among Women with Children Ages 6 to 17 years
COMPARE
Indian (Asian)
Immigrants from Cuba
Unemployment Among Women with Children Ages 6 to 17 years
Unemployment Among Women with Children Ages 6 to 17 years Comparison
Indians (Asian)
Immigrants from Cuba
7.7%
UNEMPLOYMENT AMONG WOMEN WITH CHILDREN AGES 6 TO 17 YEARS
100.0/ 100
METRIC RATING
26th/ 347
METRIC RANK
9.2%
UNEMPLOYMENT AMONG WOMEN WITH CHILDREN AGES 6 TO 17 YEARS
9.6/ 100
METRIC RATING
211th/ 347
METRIC RANK
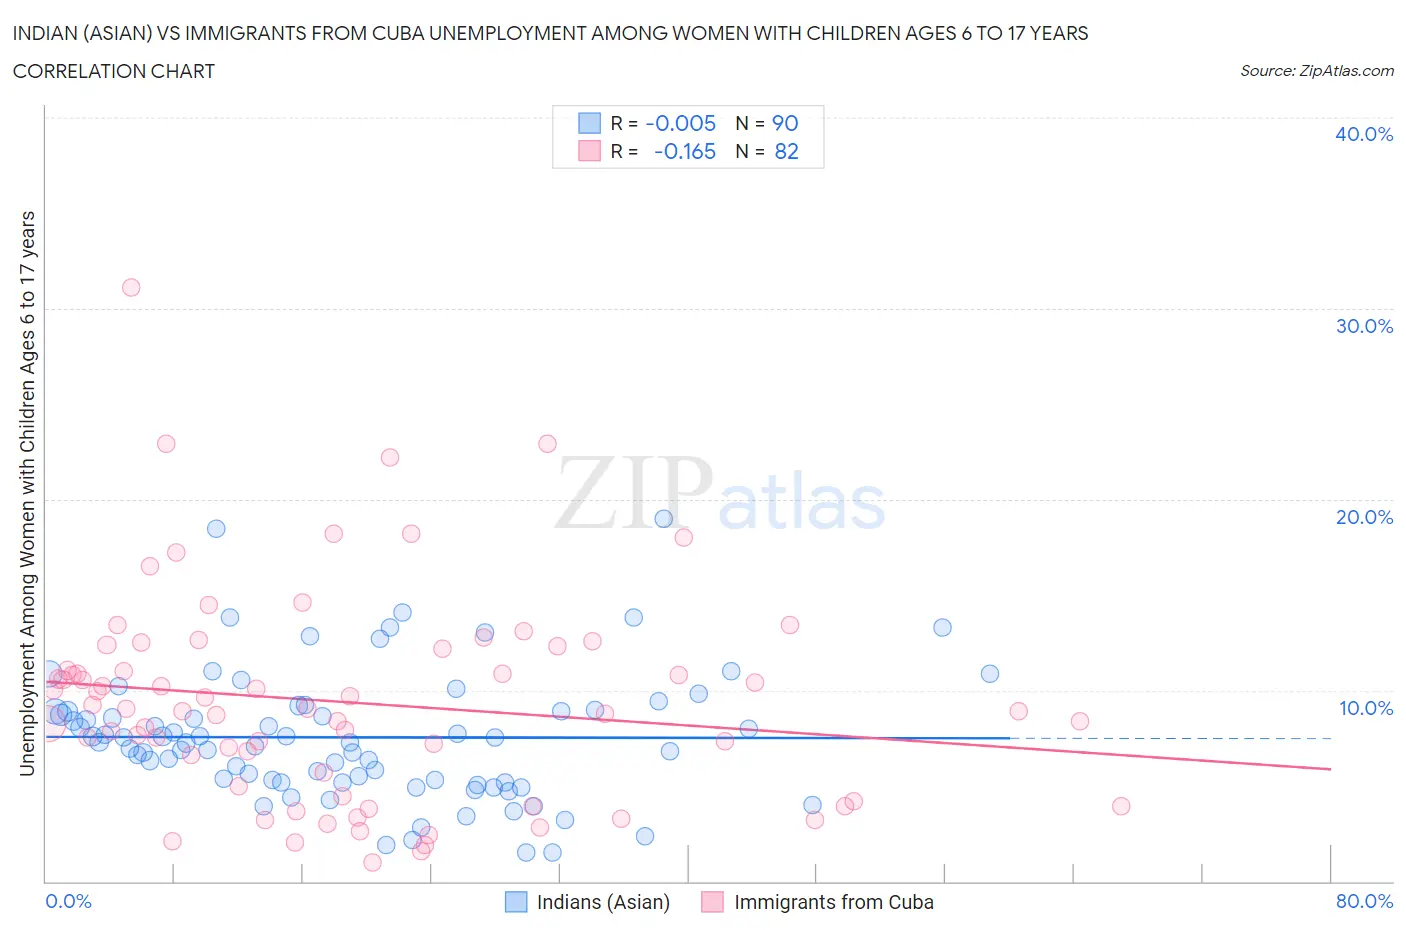
Indian (Asian) vs Immigrants from Cuba Unemployment Among Women with Children Ages 6 to 17 years Correlation Chart
The statistical analysis conducted on geographies consisting of 335,697,712 people shows no correlation between the proportion of Indians (Asian) and unemployment rate among women with children between the ages 6 and 17 in the United States with a correlation coefficient (R) of -0.005 and weighted average of 7.7%. Similarly, the statistical analysis conducted on geographies consisting of 247,117,453 people shows a poor negative correlation between the proportion of Immigrants from Cuba and unemployment rate among women with children between the ages 6 and 17 in the United States with a correlation coefficient (R) of -0.165 and weighted average of 9.2%, a difference of 18.9%.
Unemployment Among Women with Children Ages 6 to 17 years Correlation Summary
| Measurement | Indian (Asian) | Immigrants from Cuba |
| Minimum | 1.5% | 1.0% |
| Maximum | 19.0% | 31.1% |
| Range | 17.5% | 30.1% |
| Mean | 7.5% | 9.4% |
| Median | 7.3% | 9.0% |
| Interquartile 25% (IQ1) | 5.2% | 5.0% |
| Interquartile 75% (IQ3) | 8.9% | 12.2% |
| Interquartile Range (IQR) | 3.7% | 7.2% |
| Standard Deviation (Sample) | 3.4% | 5.5% |
| Standard Deviation (Population) | 3.4% | 5.5% |
Similar Demographics by Unemployment Among Women with Children Ages 6 to 17 years
Demographics Similar to Indians (Asian) by Unemployment Among Women with Children Ages 6 to 17 years
In terms of unemployment among women with children ages 6 to 17 years, the demographic groups most similar to Indians (Asian) are Immigrants from Eastern Asia (7.7%, a difference of 0.010%), Immigrants from Indonesia (7.7%, a difference of 0.13%), Nepalese (7.7%, a difference of 0.13%), Immigrants from China (7.7%, a difference of 0.52%), and Immigrants from Afghanistan (7.8%, a difference of 0.63%).
| Demographics | Rating | Rank | Unemployment Among Women with Children Ages 6 to 17 years |
| Filipinos | 100.0 /100 | #19 | Exceptional 7.6% |
| Immigrants | Singapore | 100.0 /100 | #20 | Exceptional 7.7% |
| Immigrants | India | 100.0 /100 | #21 | Exceptional 7.7% |
| Immigrants | China | 100.0 /100 | #22 | Exceptional 7.7% |
| Immigrants | Indonesia | 100.0 /100 | #23 | Exceptional 7.7% |
| Nepalese | 100.0 /100 | #24 | Exceptional 7.7% |
| Immigrants | Eastern Asia | 100.0 /100 | #25 | Exceptional 7.7% |
| Indians (Asian) | 100.0 /100 | #26 | Exceptional 7.7% |
| Immigrants | Afghanistan | 100.0 /100 | #27 | Exceptional 7.8% |
| Immigrants | Uzbekistan | 100.0 /100 | #28 | Exceptional 7.8% |
| Thais | 100.0 /100 | #29 | Exceptional 7.8% |
| Immigrants | Iran | 100.0 /100 | #30 | Exceptional 7.9% |
| Laotians | 100.0 /100 | #31 | Exceptional 7.9% |
| Immigrants | Cambodia | 100.0 /100 | #32 | Exceptional 7.9% |
| Immigrants | Korea | 100.0 /100 | #33 | Exceptional 7.9% |
Demographics Similar to Immigrants from Cuba by Unemployment Among Women with Children Ages 6 to 17 years
In terms of unemployment among women with children ages 6 to 17 years, the demographic groups most similar to Immigrants from Cuba are Finnish (9.2%, a difference of 0.050%), Peruvian (9.2%, a difference of 0.080%), Salvadoran (9.2%, a difference of 0.14%), Cuban (9.2%, a difference of 0.15%), and Immigrants from Peru (9.2%, a difference of 0.15%).
| Demographics | Rating | Rank | Unemployment Among Women with Children Ages 6 to 17 years |
| Immigrants | Canada | 15.3 /100 | #204 | Poor 9.1% |
| Immigrants | Western Europe | 14.1 /100 | #205 | Poor 9.1% |
| Immigrants | North America | 12.7 /100 | #206 | Poor 9.2% |
| Cubans | 10.9 /100 | #207 | Poor 9.2% |
| Immigrants | Peru | 10.8 /100 | #208 | Poor 9.2% |
| Salvadorans | 10.7 /100 | #209 | Poor 9.2% |
| Finns | 10.0 /100 | #210 | Tragic 9.2% |
| Immigrants | Cuba | 9.6 /100 | #211 | Tragic 9.2% |
| Peruvians | 9.0 /100 | #212 | Tragic 9.2% |
| Spaniards | 8.2 /100 | #213 | Tragic 9.2% |
| Iroquois | 7.5 /100 | #214 | Tragic 9.2% |
| Immigrants | Germany | 7.2 /100 | #215 | Tragic 9.2% |
| Immigrants | Uruguay | 7.2 /100 | #216 | Tragic 9.2% |
| Germans | 7.2 /100 | #217 | Tragic 9.2% |
| Syrians | 6.9 /100 | #218 | Tragic 9.2% |