Kenyan vs Immigrants from Latvia Unemployment Among Ages 25 to 29 years
COMPARE
Kenyan
Immigrants from Latvia
Unemployment Among Ages 25 to 29 years
Unemployment Among Ages 25 to 29 years Comparison
Kenyans
Immigrants from Latvia
6.3%
UNEMPLOYMENT AMONG AGES 25 TO 29 YEARS
98.0/ 100
METRIC RATING
63rd/ 347
METRIC RANK
6.6%
UNEMPLOYMENT AMONG AGES 25 TO 29 YEARS
63.9/ 100
METRIC RATING
155th/ 347
METRIC RANK
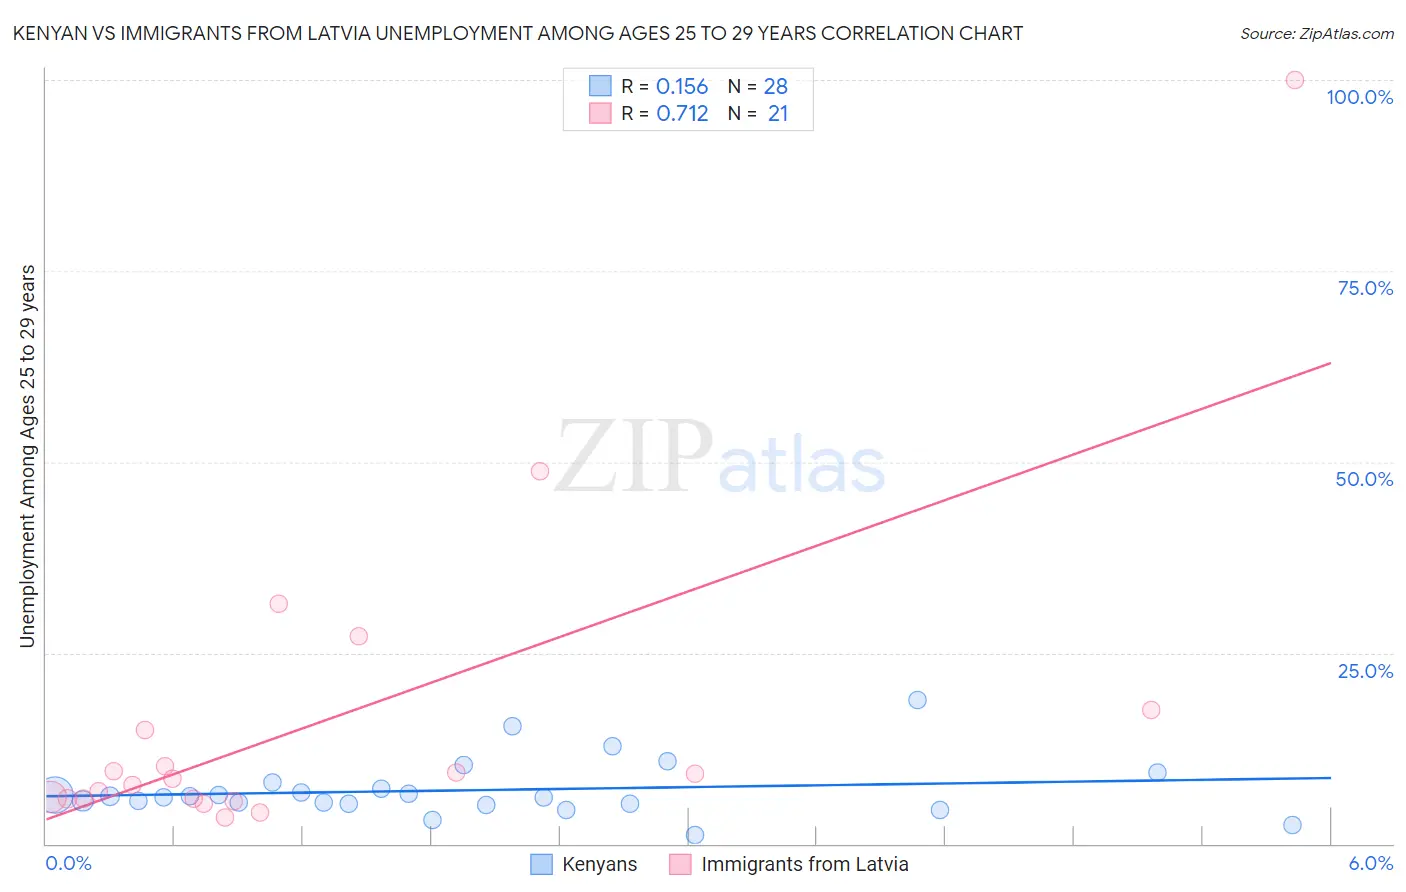
Kenyan vs Immigrants from Latvia Unemployment Among Ages 25 to 29 years Correlation Chart
The statistical analysis conducted on geographies consisting of 165,555,949 people shows a poor positive correlation between the proportion of Kenyans and unemployment rate among population between the ages 25 and 29 in the United States with a correlation coefficient (R) of 0.156 and weighted average of 6.3%. Similarly, the statistical analysis conducted on geographies consisting of 111,655,823 people shows a strong positive correlation between the proportion of Immigrants from Latvia and unemployment rate among population between the ages 25 and 29 in the United States with a correlation coefficient (R) of 0.712 and weighted average of 6.6%, a difference of 5.4%.
Unemployment Among Ages 25 to 29 years Correlation Summary
| Measurement | Kenyan | Immigrants from Latvia |
| Minimum | 1.2% | 3.4% |
| Maximum | 18.8% | 100.0% |
| Range | 17.6% | 96.6% |
| Mean | 7.0% | 16.3% |
| Median | 6.1% | 8.5% |
| Interquartile 25% (IQ1) | 5.2% | 5.9% |
| Interquartile 75% (IQ3) | 7.6% | 16.2% |
| Interquartile Range (IQR) | 2.4% | 10.3% |
| Standard Deviation (Sample) | 3.8% | 22.1% |
| Standard Deviation (Population) | 3.7% | 21.6% |
Similar Demographics by Unemployment Among Ages 25 to 29 years
Demographics Similar to Kenyans by Unemployment Among Ages 25 to 29 years
In terms of unemployment among ages 25 to 29 years, the demographic groups most similar to Kenyans are Immigrants from Sri Lanka (6.3%, a difference of 0.050%), Immigrants from China (6.2%, a difference of 0.070%), Immigrants from Lebanon (6.3%, a difference of 0.10%), Indian (Asian) (6.3%, a difference of 0.12%), and Immigrants from Northern Africa (6.3%, a difference of 0.13%).
| Demographics | Rating | Rank | Unemployment Among Ages 25 to 29 years |
| Immigrants | Burma/Myanmar | 98.7 /100 | #56 | Exceptional 6.2% |
| Immigrants | Saudi Arabia | 98.6 /100 | #57 | Exceptional 6.2% |
| Immigrants | Eastern Asia | 98.4 /100 | #58 | Exceptional 6.2% |
| Luxembourgers | 98.3 /100 | #59 | Exceptional 6.2% |
| Immigrants | Taiwan | 98.3 /100 | #60 | Exceptional 6.2% |
| Bhutanese | 98.2 /100 | #61 | Exceptional 6.2% |
| Immigrants | China | 98.1 /100 | #62 | Exceptional 6.2% |
| Kenyans | 98.0 /100 | #63 | Exceptional 6.3% |
| Immigrants | Sri Lanka | 97.9 /100 | #64 | Exceptional 6.3% |
| Immigrants | Lebanon | 97.8 /100 | #65 | Exceptional 6.3% |
| Indians (Asian) | 97.8 /100 | #66 | Exceptional 6.3% |
| Immigrants | Northern Africa | 97.8 /100 | #67 | Exceptional 6.3% |
| Palestinians | 97.7 /100 | #68 | Exceptional 6.3% |
| Immigrants | Hong Kong | 97.5 /100 | #69 | Exceptional 6.3% |
| Immigrants | Malaysia | 97.5 /100 | #70 | Exceptional 6.3% |
Demographics Similar to Immigrants from Latvia by Unemployment Among Ages 25 to 29 years
In terms of unemployment among ages 25 to 29 years, the demographic groups most similar to Immigrants from Latvia are Colombian (6.6%, a difference of 0.010%), Immigrants from Laos (6.6%, a difference of 0.020%), South African (6.6%, a difference of 0.020%), Immigrants from Italy (6.6%, a difference of 0.030%), and Samoan (6.6%, a difference of 0.050%).
| Demographics | Rating | Rank | Unemployment Among Ages 25 to 29 years |
| Peruvians | 68.1 /100 | #148 | Good 6.6% |
| Malaysians | 67.1 /100 | #149 | Good 6.6% |
| Finns | 66.9 /100 | #150 | Good 6.6% |
| Ukrainians | 65.5 /100 | #151 | Good 6.6% |
| Samoans | 64.6 /100 | #152 | Good 6.6% |
| Immigrants | Italy | 64.4 /100 | #153 | Good 6.6% |
| Colombians | 64.0 /100 | #154 | Good 6.6% |
| Immigrants | Latvia | 63.9 /100 | #155 | Good 6.6% |
| Immigrants | Laos | 63.5 /100 | #156 | Good 6.6% |
| South Africans | 63.5 /100 | #157 | Good 6.6% |
| Immigrants | Russia | 61.5 /100 | #158 | Good 6.6% |
| Welsh | 61.3 /100 | #159 | Good 6.6% |
| Scottish | 60.7 /100 | #160 | Good 6.6% |
| Paraguayans | 60.4 /100 | #161 | Good 6.6% |
| Immigrants | Czechoslovakia | 60.2 /100 | #162 | Good 6.6% |