Immigrants from Scotland vs Immigrants from Canada Unemployment Among Ages 25 to 29 years
COMPARE
Immigrants from Scotland
Immigrants from Canada
Unemployment Among Ages 25 to 29 years
Unemployment Among Ages 25 to 29 years Comparison
Immigrants from Scotland
Immigrants from Canada
6.7%
UNEMPLOYMENT AMONG AGES 25 TO 29 YEARS
39.6/ 100
METRIC RATING
183rd/ 347
METRIC RANK
6.6%
UNEMPLOYMENT AMONG AGES 25 TO 29 YEARS
55.0/ 100
METRIC RATING
167th/ 347
METRIC RANK
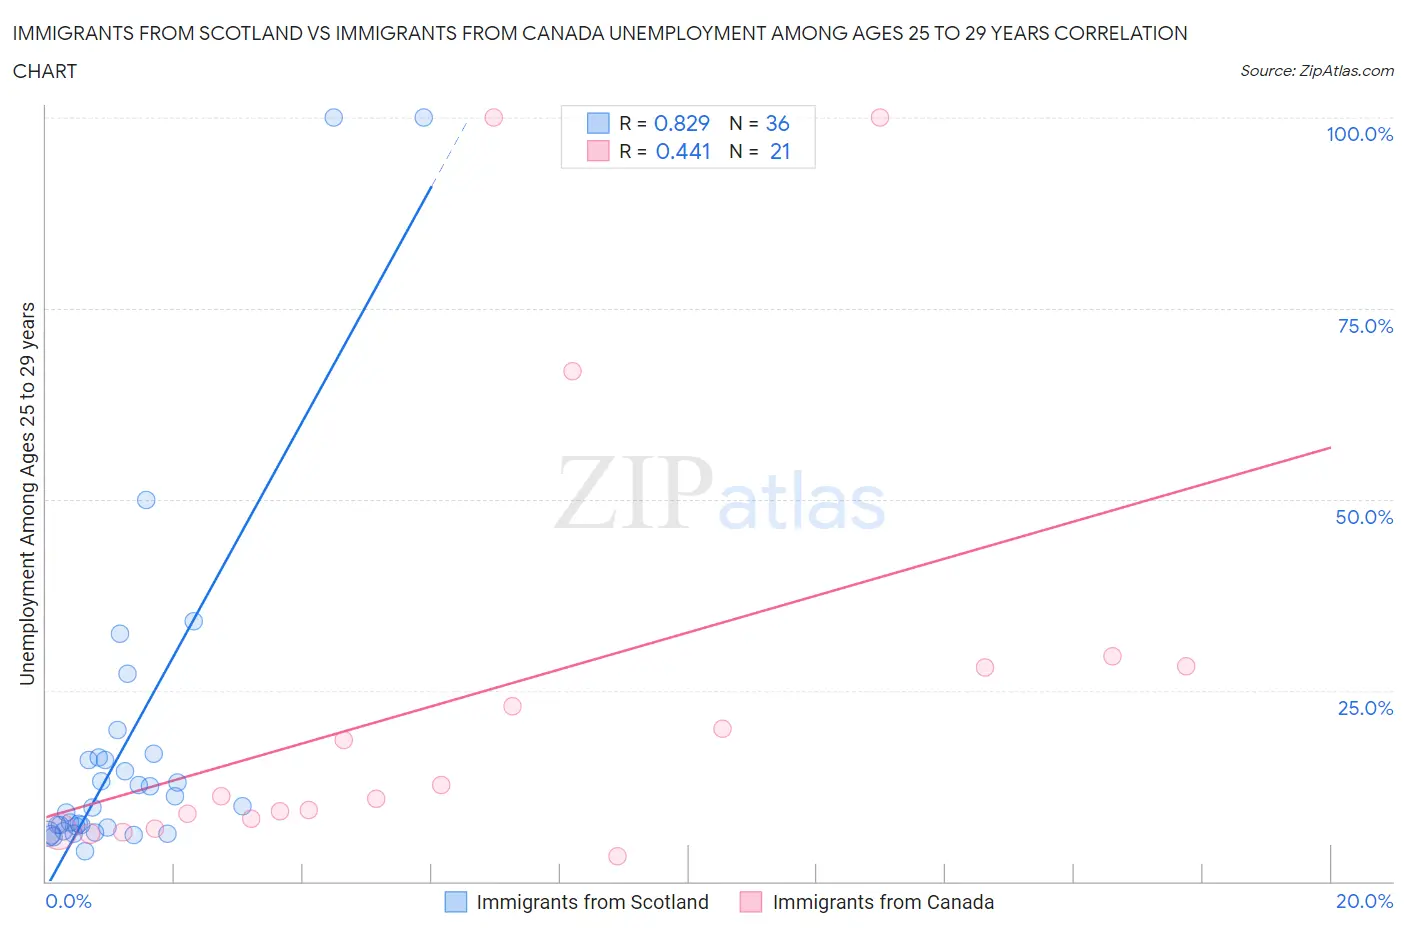
Immigrants from Scotland vs Immigrants from Canada Unemployment Among Ages 25 to 29 years Correlation Chart
The statistical analysis conducted on geographies consisting of 189,373,461 people shows a very strong positive correlation between the proportion of Immigrants from Scotland and unemployment rate among population between the ages 25 and 29 in the United States with a correlation coefficient (R) of 0.829 and weighted average of 6.7%. Similarly, the statistical analysis conducted on geographies consisting of 427,522,491 people shows a moderate positive correlation between the proportion of Immigrants from Canada and unemployment rate among population between the ages 25 and 29 in the United States with a correlation coefficient (R) of 0.441 and weighted average of 6.6%, a difference of 0.96%.
Unemployment Among Ages 25 to 29 years Correlation Summary
| Measurement | Immigrants from Scotland | Immigrants from Canada |
| Minimum | 3.9% | 3.2% |
| Maximum | 100.0% | 100.0% |
| Range | 96.1% | 96.8% |
| Mean | 17.7% | 24.4% |
| Median | 9.7% | 11.1% |
| Interquartile 25% (IQ1) | 6.8% | 7.5% |
| Interquartile 75% (IQ3) | 16.0% | 28.1% |
| Interquartile Range (IQR) | 9.3% | 20.5% |
| Standard Deviation (Sample) | 22.4% | 28.7% |
| Standard Deviation (Population) | 22.1% | 28.0% |
Demographics Similar to Immigrants from Scotland and Immigrants from Canada by Unemployment Among Ages 25 to 29 years
In terms of unemployment among ages 25 to 29 years, the demographic groups most similar to Immigrants from Scotland are Czechoslovakian (6.7%, a difference of 0.070%), Immigrants from Africa (6.7%, a difference of 0.090%), Immigrants from Western Europe (6.7%, a difference of 0.090%), Immigrants from Costa Rica (6.7%, a difference of 0.090%), and Moroccan (6.7%, a difference of 0.25%). Similarly, the demographic groups most similar to Immigrants from Canada are Estonian (6.6%, a difference of 0.020%), South American (6.6%, a difference of 0.030%), Albanian (6.6%, a difference of 0.090%), Immigrants from Northern Europe (6.6%, a difference of 0.14%), and Immigrants from Cambodia (6.6%, a difference of 0.15%).
| Demographics | Rating | Rank | Unemployment Among Ages 25 to 29 years |
| English | 58.0 /100 | #165 | Average 6.6% |
| Immigrants | Northern Europe | 57.3 /100 | #166 | Average 6.6% |
| Immigrants | Canada | 55.0 /100 | #167 | Average 6.6% |
| Estonians | 54.8 /100 | #168 | Average 6.6% |
| South Americans | 54.5 /100 | #169 | Average 6.6% |
| Albanians | 53.5 /100 | #170 | Average 6.6% |
| Immigrants | Cambodia | 52.6 /100 | #171 | Average 6.6% |
| Bangladeshis | 51.6 /100 | #172 | Average 6.6% |
| Russians | 51.3 /100 | #173 | Average 6.6% |
| Immigrants | North America | 50.0 /100 | #174 | Average 6.6% |
| Immigrants | South Eastern Asia | 49.1 /100 | #175 | Average 6.7% |
| Osage | 48.1 /100 | #176 | Average 6.7% |
| Immigrants | Israel | 47.8 /100 | #177 | Average 6.7% |
| Immigrants | Iraq | 45.1 /100 | #178 | Average 6.7% |
| Costa Ricans | 44.9 /100 | #179 | Average 6.7% |
| Immigrants | Africa | 41.1 /100 | #180 | Average 6.7% |
| Immigrants | Western Europe | 41.1 /100 | #181 | Average 6.7% |
| Czechoslovakians | 40.7 /100 | #182 | Average 6.7% |
| Immigrants | Scotland | 39.6 /100 | #183 | Fair 6.7% |
| Immigrants | Costa Rica | 38.3 /100 | #184 | Fair 6.7% |
| Moroccans | 35.9 /100 | #185 | Fair 6.7% |