Immigrants from Scotland vs Immigrants from Kenya Unemployment Among Ages 30 to 34 years
COMPARE
Immigrants from Scotland
Immigrants from Kenya
Unemployment Among Ages 30 to 34 years
Unemployment Among Ages 30 to 34 years Comparison
Immigrants from Scotland
Immigrants from Kenya
5.4%
UNEMPLOYMENT AMONG AGES 30 TO 34 YEARS
59.3/ 100
METRIC RATING
160th/ 347
METRIC RANK
5.2%
UNEMPLOYMENT AMONG AGES 30 TO 34 YEARS
93.3/ 100
METRIC RATING
88th/ 347
METRIC RANK
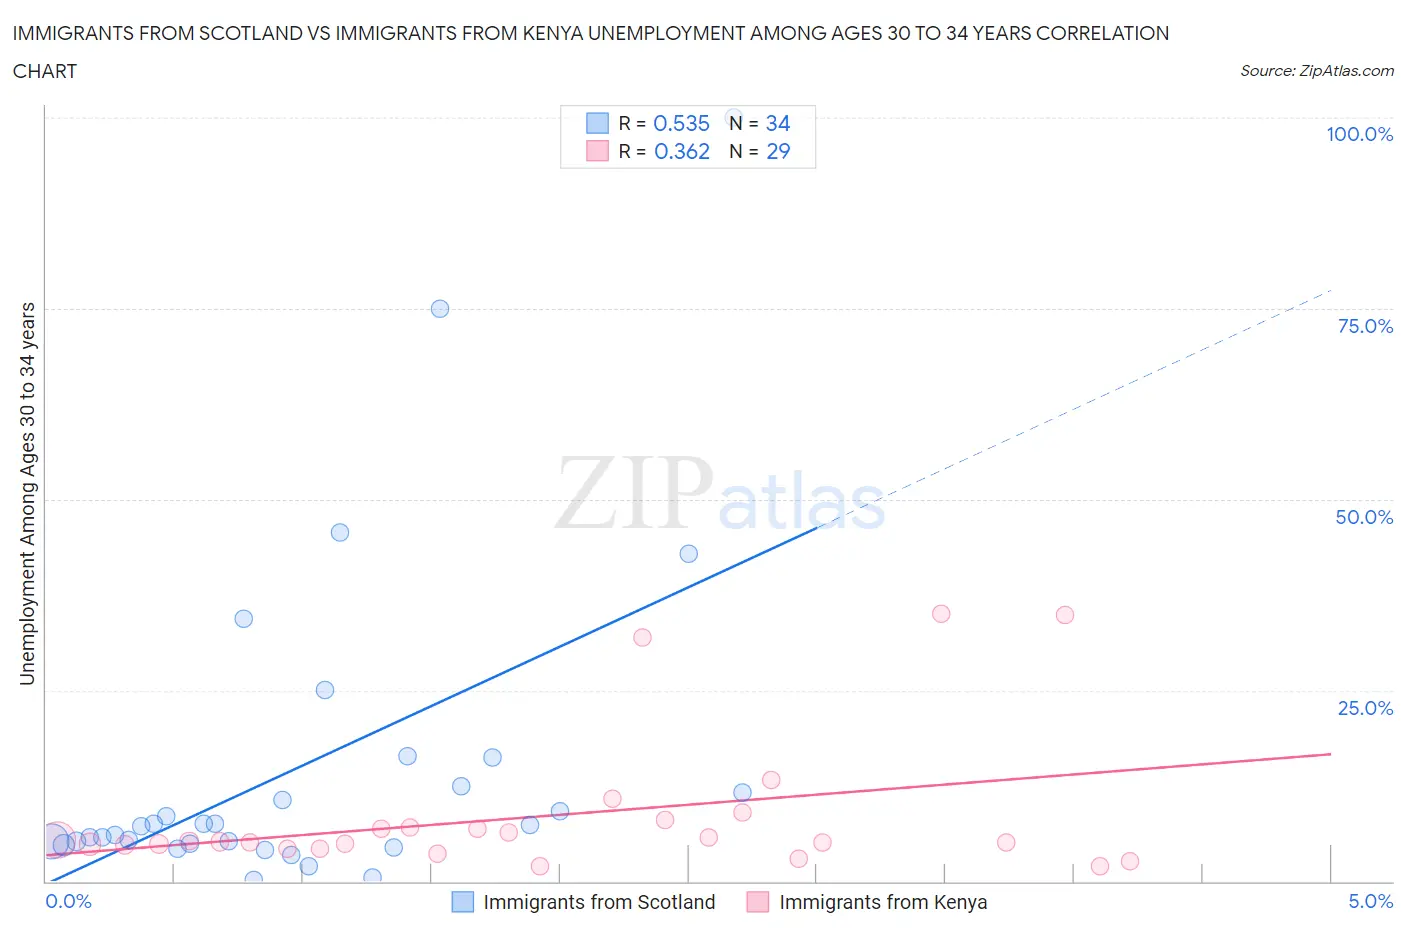
Immigrants from Scotland vs Immigrants from Kenya Unemployment Among Ages 30 to 34 years Correlation Chart
The statistical analysis conducted on geographies consisting of 188,822,725 people shows a substantial positive correlation between the proportion of Immigrants from Scotland and unemployment rate among population between the ages 30 and 34 in the United States with a correlation coefficient (R) of 0.535 and weighted average of 5.4%. Similarly, the statistical analysis conducted on geographies consisting of 212,957,240 people shows a mild positive correlation between the proportion of Immigrants from Kenya and unemployment rate among population between the ages 30 and 34 in the United States with a correlation coefficient (R) of 0.362 and weighted average of 5.2%, a difference of 4.1%.
Unemployment Among Ages 30 to 34 years Correlation Summary
| Measurement | Immigrants from Scotland | Immigrants from Kenya |
| Minimum | 0.20% | 1.9% |
| Maximum | 100.0% | 35.1% |
| Range | 99.8% | 33.2% |
| Mean | 15.1% | 8.5% |
| Median | 7.3% | 5.2% |
| Interquartile 25% (IQ1) | 4.8% | 4.5% |
| Interquartile 75% (IQ3) | 12.5% | 7.5% |
| Interquartile Range (IQR) | 7.7% | 3.0% |
| Standard Deviation (Sample) | 21.6% | 9.1% |
| Standard Deviation (Population) | 21.2% | 9.0% |
Similar Demographics by Unemployment Among Ages 30 to 34 years
Demographics Similar to Immigrants from Scotland by Unemployment Among Ages 30 to 34 years
In terms of unemployment among ages 30 to 34 years, the demographic groups most similar to Immigrants from Scotland are Austrian (5.4%, a difference of 0.020%), Brazilian (5.4%, a difference of 0.080%), Arab (5.4%, a difference of 0.12%), Immigrants from Croatia (5.4%, a difference of 0.13%), and Basque (5.4%, a difference of 0.14%).
| Demographics | Rating | Rank | Unemployment Among Ages 30 to 34 years |
| Immigrants | South Eastern Asia | 66.5 /100 | #153 | Good 5.4% |
| South Africans | 66.5 /100 | #154 | Good 5.4% |
| Immigrants | Hungary | 66.1 /100 | #155 | Good 5.4% |
| Czechoslovakians | 63.7 /100 | #156 | Good 5.4% |
| Albanians | 63.7 /100 | #157 | Good 5.4% |
| Immigrants | Belarus | 62.7 /100 | #158 | Good 5.4% |
| Immigrants | Croatia | 61.0 /100 | #159 | Good 5.4% |
| Immigrants | Scotland | 59.3 /100 | #160 | Average 5.4% |
| Austrians | 59.0 /100 | #161 | Average 5.4% |
| Brazilians | 58.2 /100 | #162 | Average 5.4% |
| Arabs | 57.7 /100 | #163 | Average 5.4% |
| Basques | 57.3 /100 | #164 | Average 5.4% |
| Welsh | 56.3 /100 | #165 | Average 5.4% |
| Immigrants | Thailand | 55.6 /100 | #166 | Average 5.4% |
| English | 54.8 /100 | #167 | Average 5.4% |
Demographics Similar to Immigrants from Kenya by Unemployment Among Ages 30 to 34 years
In terms of unemployment among ages 30 to 34 years, the demographic groups most similar to Immigrants from Kenya are Immigrants from Sweden (5.2%, a difference of 0.010%), Immigrants from Australia (5.2%, a difference of 0.040%), Bhutanese (5.2%, a difference of 0.040%), Immigrants from Romania (5.2%, a difference of 0.15%), and Immigrants from Egypt (5.2%, a difference of 0.16%).
| Demographics | Rating | Rank | Unemployment Among Ages 30 to 34 years |
| Chileans | 94.4 /100 | #81 | Exceptional 5.2% |
| Immigrants | Latvia | 94.2 /100 | #82 | Exceptional 5.2% |
| Immigrants | Korea | 94.1 /100 | #83 | Exceptional 5.2% |
| Immigrants | Uganda | 94.0 /100 | #84 | Exceptional 5.2% |
| Immigrants | Egypt | 93.9 /100 | #85 | Exceptional 5.2% |
| Immigrants | Australia | 93.5 /100 | #86 | Exceptional 5.2% |
| Bhutanese | 93.5 /100 | #87 | Exceptional 5.2% |
| Immigrants | Kenya | 93.3 /100 | #88 | Exceptional 5.2% |
| Immigrants | Sweden | 93.3 /100 | #89 | Exceptional 5.2% |
| Immigrants | Romania | 92.8 /100 | #90 | Exceptional 5.2% |
| Iraqis | 92.6 /100 | #91 | Exceptional 5.2% |
| Immigrants | Argentina | 92.5 /100 | #92 | Exceptional 5.2% |
| Laotians | 92.4 /100 | #93 | Exceptional 5.2% |
| Maltese | 92.3 /100 | #94 | Exceptional 5.2% |
| Kenyans | 92.1 /100 | #95 | Exceptional 5.2% |