Immigrants from Saudi Arabia vs Immigrants from Ireland Unemployment Among Women with Children Under 6 years
COMPARE
Immigrants from Saudi Arabia
Immigrants from Ireland
Unemployment Among Women with Children Under 6 years
Unemployment Among Women with Children Under 6 years Comparison
Immigrants from Saudi Arabia
Immigrants from Ireland
7.2%
UNEMPLOYMENT AMONG WOMEN WITH CHILDREN UNDER 6 YEARS
97.3/ 100
METRIC RATING
103rd/ 347
METRIC RANK
6.8%
UNEMPLOYMENT AMONG WOMEN WITH CHILDREN UNDER 6 YEARS
99.9/ 100
METRIC RATING
50th/ 347
METRIC RANK
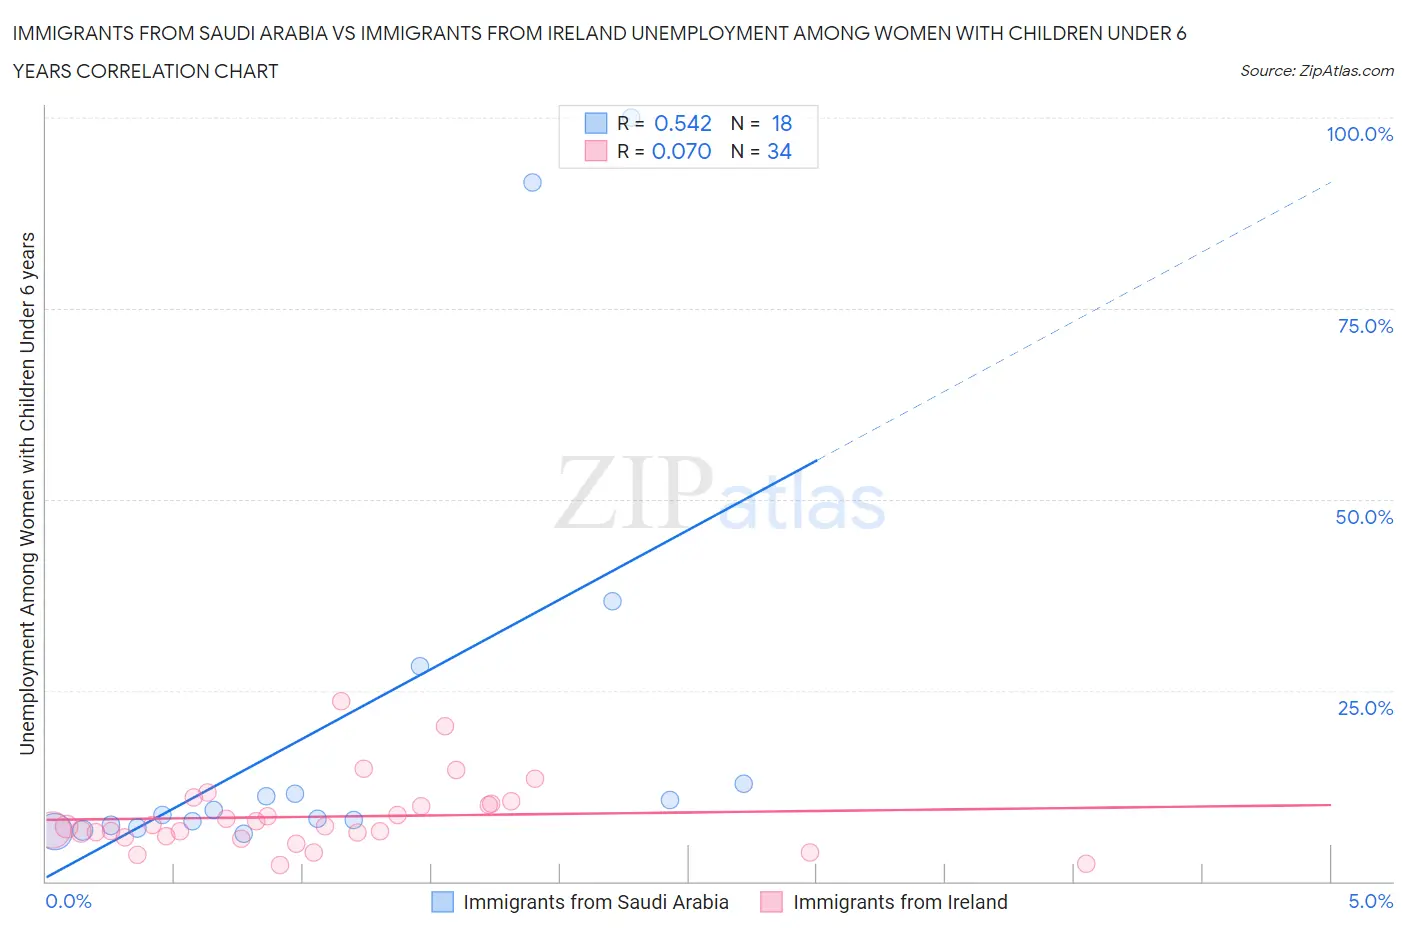
Immigrants from Saudi Arabia vs Immigrants from Ireland Unemployment Among Women with Children Under 6 years Correlation Chart
The statistical analysis conducted on geographies consisting of 143,989,640 people shows a substantial positive correlation between the proportion of Immigrants from Saudi Arabia and unemployment rate among women with children under the age of 6 in the United States with a correlation coefficient (R) of 0.542 and weighted average of 7.2%. Similarly, the statistical analysis conducted on geographies consisting of 193,495,691 people shows a slight positive correlation between the proportion of Immigrants from Ireland and unemployment rate among women with children under the age of 6 in the United States with a correlation coefficient (R) of 0.070 and weighted average of 6.8%, a difference of 6.0%.
Unemployment Among Women with Children Under 6 years Correlation Summary
| Measurement | Immigrants from Saudi Arabia | Immigrants from Ireland |
| Minimum | 6.3% | 2.2% |
| Maximum | 100.0% | 23.6% |
| Range | 93.7% | 21.4% |
| Mean | 21.0% | 8.5% |
| Median | 9.0% | 7.2% |
| Interquartile 25% (IQ1) | 7.3% | 5.9% |
| Interquartile 75% (IQ3) | 12.8% | 10.1% |
| Interquartile Range (IQR) | 5.5% | 4.2% |
| Standard Deviation (Sample) | 28.4% | 4.6% |
| Standard Deviation (Population) | 27.6% | 4.6% |
Similar Demographics by Unemployment Among Women with Children Under 6 years
Demographics Similar to Immigrants from Saudi Arabia by Unemployment Among Women with Children Under 6 years
In terms of unemployment among women with children under 6 years, the demographic groups most similar to Immigrants from Saudi Arabia are Immigrants from Nicaragua (7.2%, a difference of 0.0%), Chilean (7.2%, a difference of 0.030%), Immigrants from Northern Europe (7.2%, a difference of 0.050%), Immigrants from Egypt (7.2%, a difference of 0.080%), and Venezuelan (7.2%, a difference of 0.090%).
| Demographics | Rating | Rank | Unemployment Among Women with Children Under 6 years |
| Immigrants | Eastern Africa | 97.7 /100 | #96 | Exceptional 7.2% |
| Immigrants | South Eastern Asia | 97.6 /100 | #97 | Exceptional 7.2% |
| Russians | 97.5 /100 | #98 | Exceptional 7.2% |
| Immigrants | Europe | 97.5 /100 | #99 | Exceptional 7.2% |
| Immigrants | Northern Europe | 97.4 /100 | #100 | Exceptional 7.2% |
| Chileans | 97.4 /100 | #101 | Exceptional 7.2% |
| Immigrants | Nicaragua | 97.3 /100 | #102 | Exceptional 7.2% |
| Immigrants | Saudi Arabia | 97.3 /100 | #103 | Exceptional 7.2% |
| Immigrants | Egypt | 97.2 /100 | #104 | Exceptional 7.2% |
| Venezuelans | 97.2 /100 | #105 | Exceptional 7.2% |
| Immigrants | Pakistan | 97.2 /100 | #106 | Exceptional 7.2% |
| Immigrants | Kazakhstan | 97.1 /100 | #107 | Exceptional 7.2% |
| Eastern Europeans | 96.9 /100 | #108 | Exceptional 7.2% |
| Australians | 96.9 /100 | #109 | Exceptional 7.2% |
| Palestinians | 96.8 /100 | #110 | Exceptional 7.2% |
Demographics Similar to Immigrants from Ireland by Unemployment Among Women with Children Under 6 years
In terms of unemployment among women with children under 6 years, the demographic groups most similar to Immigrants from Ireland are Immigrants from Nepal (6.8%, a difference of 0.010%), Ethiopian (6.8%, a difference of 0.020%), Immigrants from Switzerland (6.8%, a difference of 0.060%), Immigrants from Asia (6.8%, a difference of 0.090%), and Immigrants from Iran (6.8%, a difference of 0.13%).
| Demographics | Rating | Rank | Unemployment Among Women with Children Under 6 years |
| Bhutanese | 99.9 /100 | #43 | Exceptional 6.7% |
| Iranians | 99.9 /100 | #44 | Exceptional 6.7% |
| Immigrants | Australia | 99.9 /100 | #45 | Exceptional 6.8% |
| Latvians | 99.9 /100 | #46 | Exceptional 6.8% |
| Immigrants | Asia | 99.9 /100 | #47 | Exceptional 6.8% |
| Immigrants | Switzerland | 99.9 /100 | #48 | Exceptional 6.8% |
| Immigrants | Nepal | 99.9 /100 | #49 | Exceptional 6.8% |
| Immigrants | Ireland | 99.9 /100 | #50 | Exceptional 6.8% |
| Ethiopians | 99.9 /100 | #51 | Exceptional 6.8% |
| Immigrants | Iran | 99.9 /100 | #52 | Exceptional 6.8% |
| Chinese | 99.9 /100 | #53 | Exceptional 6.8% |
| Immigrants | Latvia | 99.9 /100 | #54 | Exceptional 6.8% |
| Immigrants | Ukraine | 99.8 /100 | #55 | Exceptional 6.8% |
| Immigrants | Ethiopia | 99.8 /100 | #56 | Exceptional 6.9% |
| Icelanders | 99.8 /100 | #57 | Exceptional 6.9% |