Immigrants from Armenia vs Tlingit-Haida Unemployment Among Ages 55 to 59 years
COMPARE
Immigrants from Armenia
Tlingit-Haida
Unemployment Among Ages 55 to 59 years
Unemployment Among Ages 55 to 59 years Comparison
Immigrants from Armenia
Tlingit-Haida
6.0%
UNEMPLOYMENT AMONG AGES 55 TO 59 YEARS
0.0/ 100
METRIC RATING
325th/ 347
METRIC RANK
5.7%
UNEMPLOYMENT AMONG AGES 55 TO 59 YEARS
0.0/ 100
METRIC RATING
314th/ 347
METRIC RANK
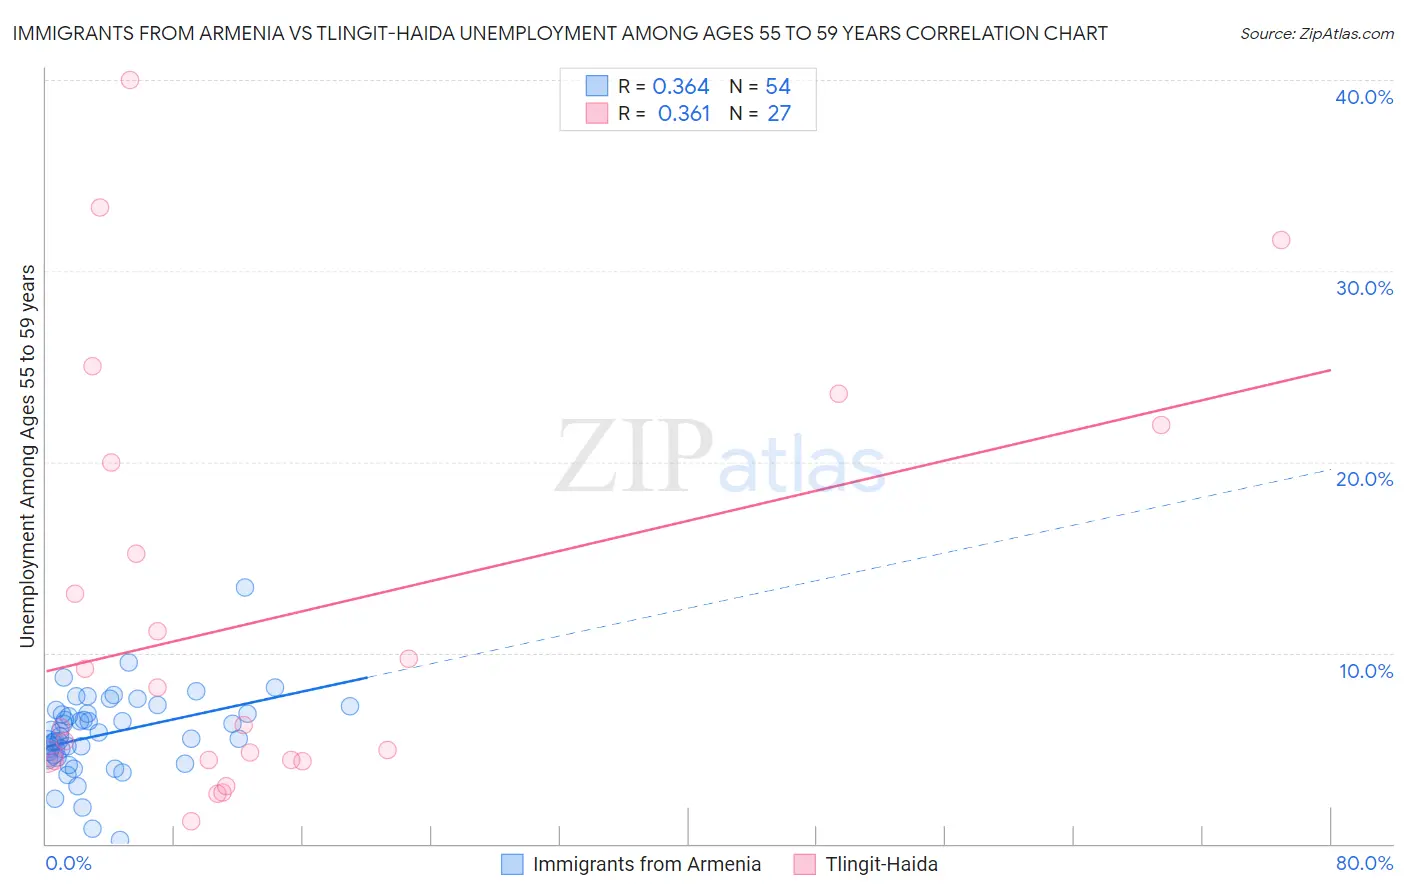
Immigrants from Armenia vs Tlingit-Haida Unemployment Among Ages 55 to 59 years Correlation Chart
The statistical analysis conducted on geographies consisting of 96,295,490 people shows a mild positive correlation between the proportion of Immigrants from Armenia and unemployment rate among population between the ages 55 and 59 in the United States with a correlation coefficient (R) of 0.364 and weighted average of 6.0%. Similarly, the statistical analysis conducted on geographies consisting of 58,839,053 people shows a mild positive correlation between the proportion of Tlingit-Haida and unemployment rate among population between the ages 55 and 59 in the United States with a correlation coefficient (R) of 0.361 and weighted average of 5.7%, a difference of 5.7%.
Unemployment Among Ages 55 to 59 years Correlation Summary
| Measurement | Immigrants from Armenia | Tlingit-Haida |
| Minimum | 0.20% | 1.2% |
| Maximum | 13.4% | 40.0% |
| Range | 13.2% | 38.8% |
| Mean | 5.7% | 11.9% |
| Median | 5.7% | 6.2% |
| Interquartile 25% (IQ1) | 4.7% | 4.4% |
| Interquartile 75% (IQ3) | 6.8% | 20.0% |
| Interquartile Range (IQR) | 2.1% | 15.6% |
| Standard Deviation (Sample) | 2.1% | 10.7% |
| Standard Deviation (Population) | 2.1% | 10.5% |
Demographics Similar to Immigrants from Armenia and Tlingit-Haida by Unemployment Among Ages 55 to 59 years
In terms of unemployment among ages 55 to 59 years, the demographic groups most similar to Immigrants from Armenia are Native/Alaskan (6.0%, a difference of 0.37%), Arapaho (6.1%, a difference of 1.3%), Vietnamese (5.9%, a difference of 1.8%), Immigrants from Bangladesh (5.9%, a difference of 1.8%), and Crow (5.9%, a difference of 1.8%). Similarly, the demographic groups most similar to Tlingit-Haida are Guyanese (5.7%, a difference of 0.15%), Central American Indian (5.6%, a difference of 0.29%), Immigrants from Ecuador (5.7%, a difference of 0.34%), Ecuadorian (5.6%, a difference of 0.48%), and Hmong (5.7%, a difference of 0.57%).
| Demographics | Rating | Rank | Unemployment Among Ages 55 to 59 years |
| Nepalese | 0.0 /100 | #309 | Tragic 5.6% |
| Belizeans | 0.0 /100 | #310 | Tragic 5.6% |
| Houma | 0.0 /100 | #311 | Tragic 5.6% |
| Ecuadorians | 0.0 /100 | #312 | Tragic 5.6% |
| Central American Indians | 0.0 /100 | #313 | Tragic 5.6% |
| Tlingit-Haida | 0.0 /100 | #314 | Tragic 5.7% |
| Guyanese | 0.0 /100 | #315 | Tragic 5.7% |
| Immigrants | Ecuador | 0.0 /100 | #316 | Tragic 5.7% |
| Hmong | 0.0 /100 | #317 | Tragic 5.7% |
| Immigrants | Guyana | 0.0 /100 | #318 | Tragic 5.8% |
| Kiowa | 0.0 /100 | #319 | Tragic 5.8% |
| Immigrants | Azores | 0.0 /100 | #320 | Tragic 5.8% |
| Chippewa | 0.0 /100 | #321 | Tragic 5.9% |
| Crow | 0.0 /100 | #322 | Tragic 5.9% |
| Immigrants | Bangladesh | 0.0 /100 | #323 | Tragic 5.9% |
| Vietnamese | 0.0 /100 | #324 | Tragic 5.9% |
| Immigrants | Armenia | 0.0 /100 | #325 | Tragic 6.0% |
| Natives/Alaskans | 0.0 /100 | #326 | Tragic 6.0% |
| Arapaho | 0.0 /100 | #327 | Tragic 6.1% |
| Yuman | 0.0 /100 | #328 | Tragic 6.1% |
| Dominicans | 0.0 /100 | #329 | Tragic 6.2% |