Immigrants from Russia vs Mexican American Indian Unemployment Among Ages 55 to 59 years
COMPARE
Immigrants from Russia
Mexican American Indian
Unemployment Among Ages 55 to 59 years
Unemployment Among Ages 55 to 59 years Comparison
Immigrants from Russia
Mexican American Indians
4.9%
UNEMPLOYMENT AMONG AGES 55 TO 59 YEARS
23.7/ 100
METRIC RATING
199th/ 347
METRIC RANK
5.2%
UNEMPLOYMENT AMONG AGES 55 TO 59 YEARS
0.0/ 100
METRIC RATING
274th/ 347
METRIC RANK
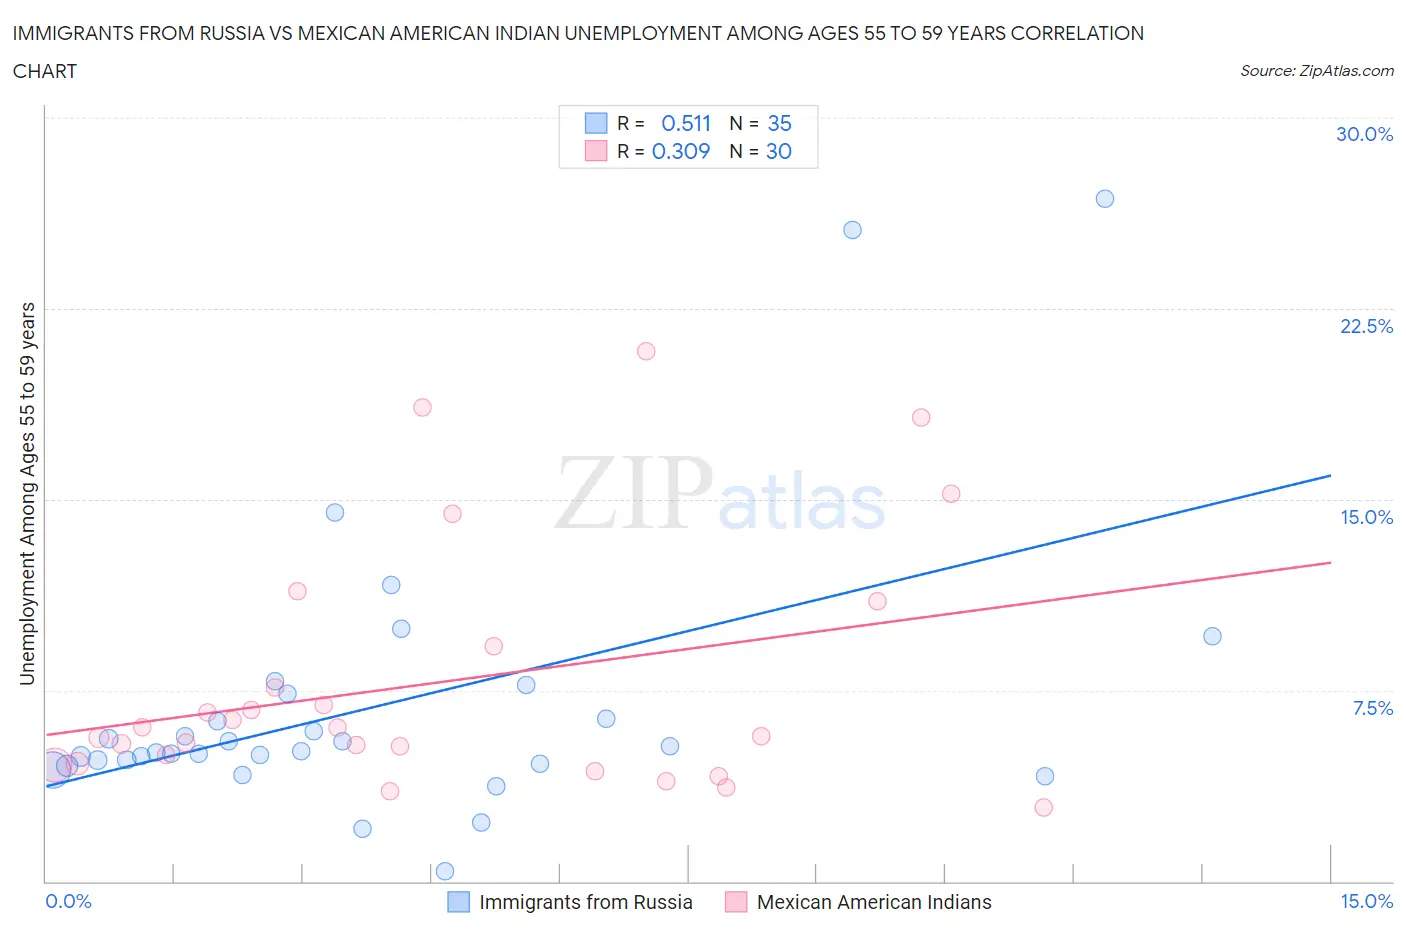
Immigrants from Russia vs Mexican American Indian Unemployment Among Ages 55 to 59 years Correlation Chart
The statistical analysis conducted on geographies consisting of 327,176,898 people shows a substantial positive correlation between the proportion of Immigrants from Russia and unemployment rate among population between the ages 55 and 59 in the United States with a correlation coefficient (R) of 0.511 and weighted average of 4.9%. Similarly, the statistical analysis conducted on geographies consisting of 299,499,153 people shows a mild positive correlation between the proportion of Mexican American Indians and unemployment rate among population between the ages 55 and 59 in the United States with a correlation coefficient (R) of 0.309 and weighted average of 5.2%, a difference of 7.0%.
Unemployment Among Ages 55 to 59 years Correlation Summary
| Measurement | Immigrants from Russia | Mexican American Indian |
| Minimum | 0.40% | 2.9% |
| Maximum | 26.8% | 20.8% |
| Range | 26.4% | 17.9% |
| Mean | 6.9% | 7.8% |
| Median | 5.1% | 5.9% |
| Interquartile 25% (IQ1) | 4.6% | 4.6% |
| Interquartile 75% (IQ3) | 7.4% | 9.2% |
| Interquartile Range (IQR) | 2.8% | 4.6% |
| Standard Deviation (Sample) | 5.5% | 4.9% |
| Standard Deviation (Population) | 5.4% | 4.8% |
Similar Demographics by Unemployment Among Ages 55 to 59 years
Demographics Similar to Immigrants from Russia by Unemployment Among Ages 55 to 59 years
In terms of unemployment among ages 55 to 59 years, the demographic groups most similar to Immigrants from Russia are Basque (4.9%, a difference of 0.020%), Immigrants from South America (4.9%, a difference of 0.030%), Lumbee (4.9%, a difference of 0.070%), Immigrants from Philippines (4.9%, a difference of 0.13%), and Macedonian (4.9%, a difference of 0.15%).
| Demographics | Rating | Rank | Unemployment Among Ages 55 to 59 years |
| Immigrants | Ukraine | 31.7 /100 | #192 | Fair 4.9% |
| Immigrants | Italy | 30.1 /100 | #193 | Fair 4.9% |
| Spaniards | 27.2 /100 | #194 | Fair 4.9% |
| Estonians | 27.2 /100 | #195 | Fair 4.9% |
| Eastern Europeans | 26.7 /100 | #196 | Fair 4.9% |
| Macedonians | 26.4 /100 | #197 | Fair 4.9% |
| Immigrants | Philippines | 26.1 /100 | #198 | Fair 4.9% |
| Immigrants | Russia | 23.7 /100 | #199 | Fair 4.9% |
| Basques | 23.3 /100 | #200 | Fair 4.9% |
| Immigrants | South America | 23.1 /100 | #201 | Fair 4.9% |
| Lumbee | 22.5 /100 | #202 | Fair 4.9% |
| Guamanians/Chamorros | 20.8 /100 | #203 | Fair 4.9% |
| Immigrants | Latvia | 18.5 /100 | #204 | Poor 4.9% |
| Haitians | 18.1 /100 | #205 | Poor 4.9% |
| Immigrants | Belarus | 14.1 /100 | #206 | Poor 4.9% |
Demographics Similar to Mexican American Indians by Unemployment Among Ages 55 to 59 years
In terms of unemployment among ages 55 to 59 years, the demographic groups most similar to Mexican American Indians are Israeli (5.2%, a difference of 0.10%), West Indian (5.2%, a difference of 0.11%), Ottawa (5.2%, a difference of 0.12%), Immigrants from Latin America (5.2%, a difference of 0.23%), and Immigrants from Jamaica (5.2%, a difference of 0.35%).
| Demographics | Rating | Rank | Unemployment Among Ages 55 to 59 years |
| Immigrants | Senegal | 0.1 /100 | #267 | Tragic 5.2% |
| Mexicans | 0.1 /100 | #268 | Tragic 5.2% |
| Tsimshian | 0.1 /100 | #269 | Tragic 5.2% |
| Ute | 0.1 /100 | #270 | Tragic 5.2% |
| Cree | 0.1 /100 | #271 | Tragic 5.2% |
| Immigrants | Jamaica | 0.0 /100 | #272 | Tragic 5.2% |
| Ottawa | 0.0 /100 | #273 | Tragic 5.2% |
| Mexican American Indians | 0.0 /100 | #274 | Tragic 5.2% |
| Israelis | 0.0 /100 | #275 | Tragic 5.2% |
| West Indians | 0.0 /100 | #276 | Tragic 5.2% |
| Immigrants | Latin America | 0.0 /100 | #277 | Tragic 5.2% |
| Immigrants | Barbados | 0.0 /100 | #278 | Tragic 5.2% |
| Alsatians | 0.0 /100 | #279 | Tragic 5.2% |
| Immigrants | Uzbekistan | 0.0 /100 | #280 | Tragic 5.3% |
| Guatemalans | 0.0 /100 | #281 | Tragic 5.3% |