Immigrants from Russia vs German In Labor Force | Age 16-19
COMPARE
Immigrants from Russia
German
In Labor Force | Age 16-19
In Labor Force | Age 16-19 Comparison
Immigrants from Russia
Germans
34.1%
IN LABOR FORCE | AGE 16-19
0.4/ 100
METRIC RATING
270th/ 347
METRIC RANK
44.2%
IN LABOR FORCE | AGE 16-19
100.0/ 100
METRIC RATING
10th/ 347
METRIC RANK
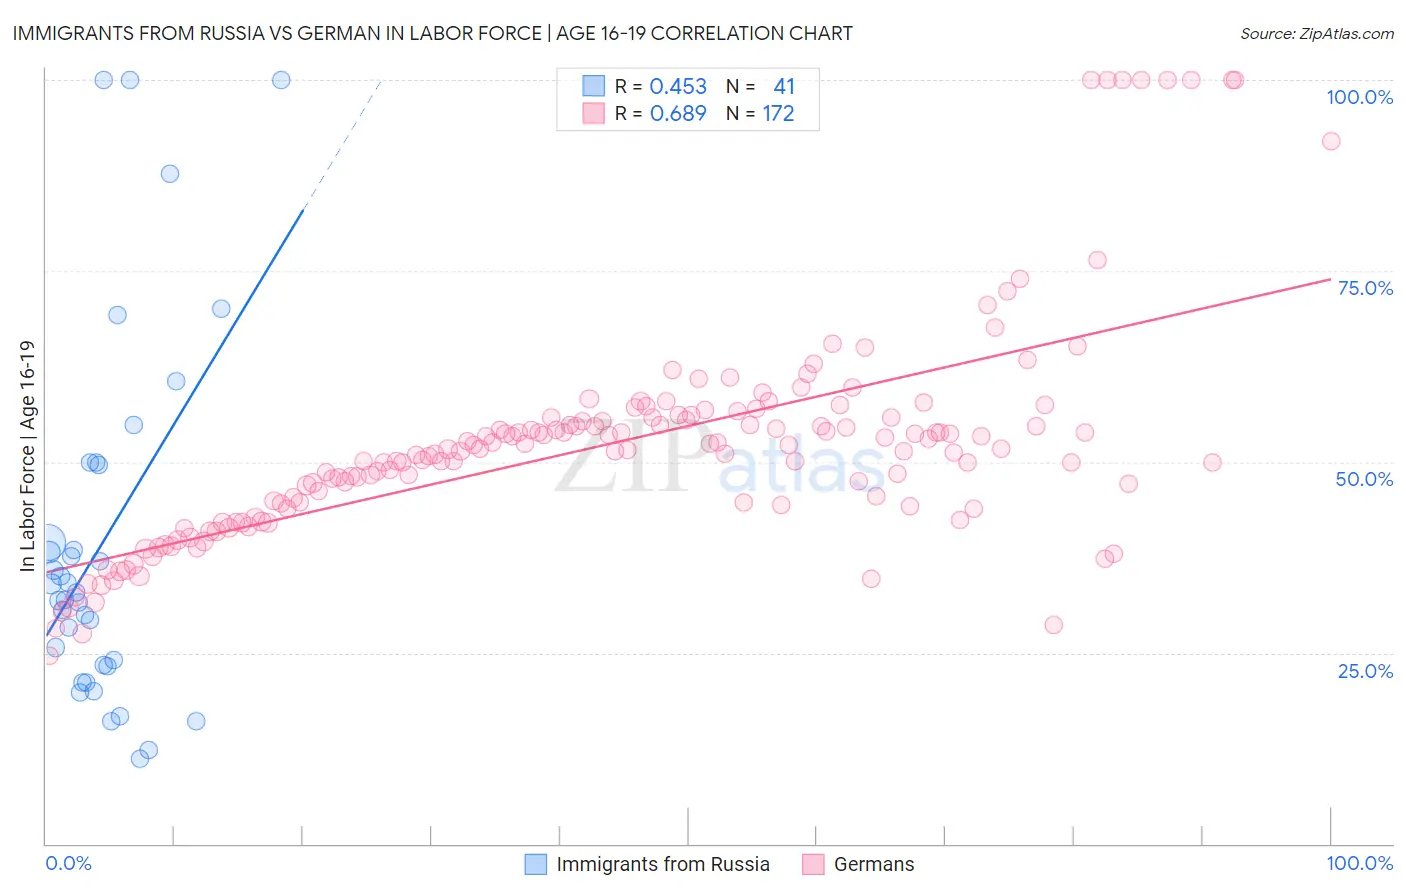
Immigrants from Russia vs German In Labor Force | Age 16-19 Correlation Chart
The statistical analysis conducted on geographies consisting of 347,439,829 people shows a moderate positive correlation between the proportion of Immigrants from Russia and labor force participation rate among population between the ages 16 and 19 in the United States with a correlation coefficient (R) of 0.453 and weighted average of 34.1%. Similarly, the statistical analysis conducted on geographies consisting of 575,301,683 people shows a significant positive correlation between the proportion of Germans and labor force participation rate among population between the ages 16 and 19 in the United States with a correlation coefficient (R) of 0.689 and weighted average of 44.2%, a difference of 29.6%.
In Labor Force | Age 16-19 Correlation Summary
| Measurement | Immigrants from Russia | German |
| Minimum | 11.2% | 24.6% |
| Maximum | 100.0% | 100.0% |
| Range | 88.8% | 75.4% |
| Mean | 39.5% | 52.2% |
| Median | 32.9% | 51.6% |
| Interquartile 25% (IQ1) | 23.3% | 44.2% |
| Interquartile 75% (IQ3) | 49.7% | 55.7% |
| Interquartile Range (IQR) | 26.4% | 11.4% |
| Standard Deviation (Sample) | 23.7% | 14.3% |
| Standard Deviation (Population) | 23.4% | 14.2% |
Similar Demographics by In Labor Force | Age 16-19
Demographics Similar to Immigrants from Russia by In Labor Force | Age 16-19
In terms of in labor force | age 16-19, the demographic groups most similar to Immigrants from Russia are Central American Indian (34.1%, a difference of 0.0%), Asian (34.1%, a difference of 0.030%), Pima (34.1%, a difference of 0.050%), Immigrants from Asia (34.1%, a difference of 0.13%), and Immigrants from Panama (34.0%, a difference of 0.24%).
| Demographics | Rating | Rank | In Labor Force | Age 16-19 |
| Burmese | 1.1 /100 | #263 | Tragic 34.5% |
| Immigrants | Uruguay | 0.9 /100 | #264 | Tragic 34.4% |
| Immigrants | El Salvador | 0.7 /100 | #265 | Tragic 34.3% |
| Immigrants | Malaysia | 0.7 /100 | #266 | Tragic 34.3% |
| Immigrants | Peru | 0.5 /100 | #267 | Tragic 34.2% |
| Immigrants | Asia | 0.5 /100 | #268 | Tragic 34.1% |
| Pima | 0.5 /100 | #269 | Tragic 34.1% |
| Immigrants | Russia | 0.4 /100 | #270 | Tragic 34.1% |
| Central American Indians | 0.4 /100 | #271 | Tragic 34.1% |
| Asians | 0.4 /100 | #272 | Tragic 34.1% |
| Immigrants | Panama | 0.4 /100 | #273 | Tragic 34.0% |
| Venezuelans | 0.3 /100 | #274 | Tragic 34.0% |
| Immigrants | Fiji | 0.3 /100 | #275 | Tragic 33.9% |
| Immigrants | Latin America | 0.3 /100 | #276 | Tragic 33.9% |
| Menominee | 0.3 /100 | #277 | Tragic 33.9% |
Demographics Similar to Germans by In Labor Force | Age 16-19
In terms of in labor force | age 16-19, the demographic groups most similar to Germans are Swedish (44.1%, a difference of 0.080%), Finnish (43.9%, a difference of 0.54%), Dutch (43.8%, a difference of 0.73%), Cape Verdean (44.5%, a difference of 0.74%), and Chippewa (43.8%, a difference of 0.83%).
| Demographics | Rating | Rank | In Labor Force | Age 16-19 |
| Immigrants | Somalia | 100.0 /100 | #3 | Exceptional 45.6% |
| Luxembourgers | 100.0 /100 | #4 | Exceptional 45.3% |
| Alaskan Athabascans | 100.0 /100 | #5 | Exceptional 45.2% |
| Somalis | 100.0 /100 | #6 | Exceptional 45.1% |
| Danes | 100.0 /100 | #7 | Exceptional 44.7% |
| Immigrants | Cabo Verde | 100.0 /100 | #8 | Exceptional 44.7% |
| Cape Verdeans | 100.0 /100 | #9 | Exceptional 44.5% |
| Germans | 100.0 /100 | #10 | Exceptional 44.2% |
| Swedes | 100.0 /100 | #11 | Exceptional 44.1% |
| Finns | 100.0 /100 | #12 | Exceptional 43.9% |
| Dutch | 100.0 /100 | #13 | Exceptional 43.8% |
| Chippewa | 100.0 /100 | #14 | Exceptional 43.8% |
| Slovenes | 100.0 /100 | #15 | Exceptional 43.7% |
| Czechs | 100.0 /100 | #16 | Exceptional 43.6% |
| Scandinavians | 100.0 /100 | #17 | Exceptional 43.6% |