Immigrants from Romania vs Cape Verdean Male Unemployment
COMPARE
Immigrants from Romania
Cape Verdean
Male Unemployment
Male Unemployment Comparison
Immigrants from Romania
Cape Verdeans
5.1%
MALE UNEMPLOYMENT
95.4/ 100
METRIC RATING
87th/ 347
METRIC RANK
7.1%
MALE UNEMPLOYMENT
0.0/ 100
METRIC RATING
318th/ 347
METRIC RANK
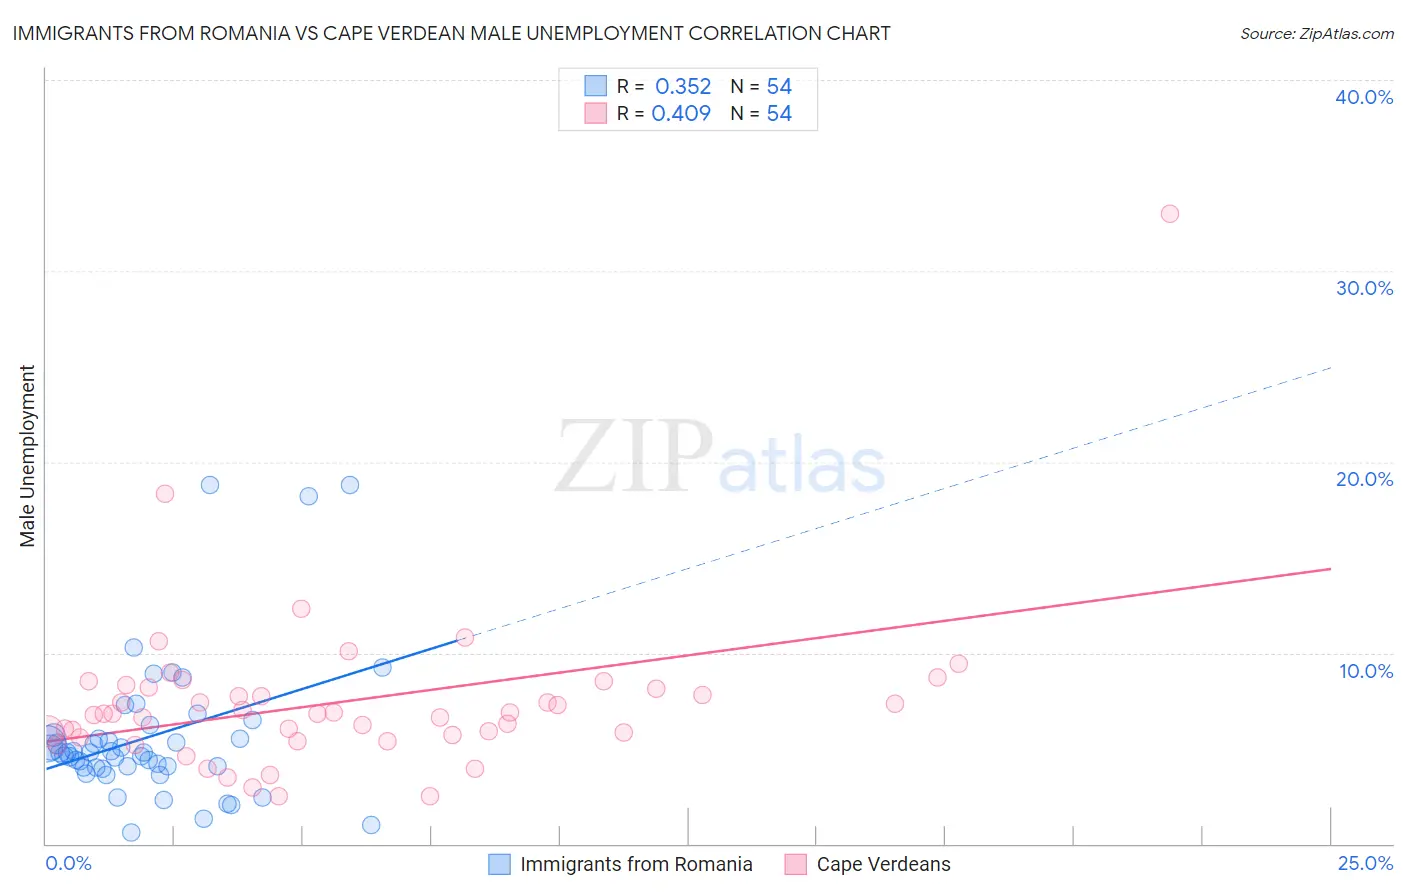
Immigrants from Romania vs Cape Verdean Male Unemployment Correlation Chart
The statistical analysis conducted on geographies consisting of 256,547,728 people shows a mild positive correlation between the proportion of Immigrants from Romania and unemployment rate among males in the United States with a correlation coefficient (R) of 0.352 and weighted average of 5.1%. Similarly, the statistical analysis conducted on geographies consisting of 107,471,642 people shows a moderate positive correlation between the proportion of Cape Verdeans and unemployment rate among males in the United States with a correlation coefficient (R) of 0.409 and weighted average of 7.1%, a difference of 40.7%.
Male Unemployment Correlation Summary
| Measurement | Immigrants from Romania | Cape Verdean |
| Minimum | 0.60% | 2.5% |
| Maximum | 18.8% | 33.0% |
| Range | 18.2% | 30.5% |
| Mean | 5.6% | 7.4% |
| Median | 4.8% | 6.8% |
| Interquartile 25% (IQ1) | 4.0% | 5.7% |
| Interquartile 75% (IQ3) | 5.7% | 8.2% |
| Interquartile Range (IQR) | 1.7% | 2.5% |
| Standard Deviation (Sample) | 3.8% | 4.4% |
| Standard Deviation (Population) | 3.7% | 4.3% |
Similar Demographics by Male Unemployment
Demographics Similar to Immigrants from Romania by Male Unemployment
In terms of male unemployment, the demographic groups most similar to Immigrants from Romania are Maltese (5.1%, a difference of 0.020%), Immigrants from North Macedonia (5.1%, a difference of 0.060%), Serbian (5.1%, a difference of 0.11%), Immigrants from Sri Lanka (5.1%, a difference of 0.19%), and Immigrants from Eritrea (5.0%, a difference of 0.22%).
| Demographics | Rating | Rank | Male Unemployment |
| Argentineans | 96.2 /100 | #80 | Exceptional 5.0% |
| French | 96.2 /100 | #81 | Exceptional 5.0% |
| Chileans | 96.2 /100 | #82 | Exceptional 5.0% |
| Immigrants | Eritrea | 96.0 /100 | #83 | Exceptional 5.0% |
| Serbians | 95.7 /100 | #84 | Exceptional 5.1% |
| Immigrants | North Macedonia | 95.6 /100 | #85 | Exceptional 5.1% |
| Maltese | 95.5 /100 | #86 | Exceptional 5.1% |
| Immigrants | Romania | 95.4 /100 | #87 | Exceptional 5.1% |
| Immigrants | Sri Lanka | 94.9 /100 | #88 | Exceptional 5.1% |
| Immigrants | Australia | 94.7 /100 | #89 | Exceptional 5.1% |
| Okinawans | 94.7 /100 | #90 | Exceptional 5.1% |
| Immigrants | Turkey | 94.4 /100 | #91 | Exceptional 5.1% |
| Slavs | 94.2 /100 | #92 | Exceptional 5.1% |
| Immigrants | Serbia | 94.2 /100 | #93 | Exceptional 5.1% |
| Canadians | 94.1 /100 | #94 | Exceptional 5.1% |
Demographics Similar to Cape Verdeans by Male Unemployment
In terms of male unemployment, the demographic groups most similar to Cape Verdeans are Guyanese (7.1%, a difference of 0.070%), Immigrants from Guyana (7.1%, a difference of 0.12%), Houma (7.1%, a difference of 0.15%), Immigrants from Barbados (7.1%, a difference of 0.36%), and Immigrants from Dominica (7.0%, a difference of 1.6%).
| Demographics | Rating | Rank | Male Unemployment |
| Immigrants | Armenia | 0.0 /100 | #311 | Tragic 6.9% |
| Lumbee | 0.0 /100 | #312 | Tragic 6.9% |
| Immigrants | Dominica | 0.0 /100 | #313 | Tragic 7.0% |
| Immigrants | Barbados | 0.0 /100 | #314 | Tragic 7.1% |
| Houma | 0.0 /100 | #315 | Tragic 7.1% |
| Immigrants | Guyana | 0.0 /100 | #316 | Tragic 7.1% |
| Guyanese | 0.0 /100 | #317 | Tragic 7.1% |
| Cape Verdeans | 0.0 /100 | #318 | Tragic 7.1% |
| British West Indians | 0.0 /100 | #319 | Tragic 7.3% |
| Colville | 0.0 /100 | #320 | Tragic 7.4% |
| Immigrants | St. Vincent and the Grenadines | 0.0 /100 | #321 | Tragic 7.5% |
| Immigrants | Cabo Verde | 0.0 /100 | #322 | Tragic 7.5% |
| Immigrants | Grenada | 0.0 /100 | #323 | Tragic 7.6% |
| Dominicans | 0.0 /100 | #324 | Tragic 7.6% |
| Shoshone | 0.0 /100 | #325 | Tragic 7.6% |