Immigrants from Romania vs Immigrants from Mexico Unemployment Among Women with Children Under 6 years
COMPARE
Immigrants from Romania
Immigrants from Mexico
Unemployment Among Women with Children Under 6 years
Unemployment Among Women with Children Under 6 years Comparison
Immigrants from Romania
Immigrants from Mexico
7.1%
UNEMPLOYMENT AMONG WOMEN WITH CHILDREN UNDER 6 YEARS
98.7/ 100
METRIC RATING
85th/ 347
METRIC RANK
9.1%
UNEMPLOYMENT AMONG WOMEN WITH CHILDREN UNDER 6 YEARS
0.0/ 100
METRIC RATING
304th/ 347
METRIC RANK
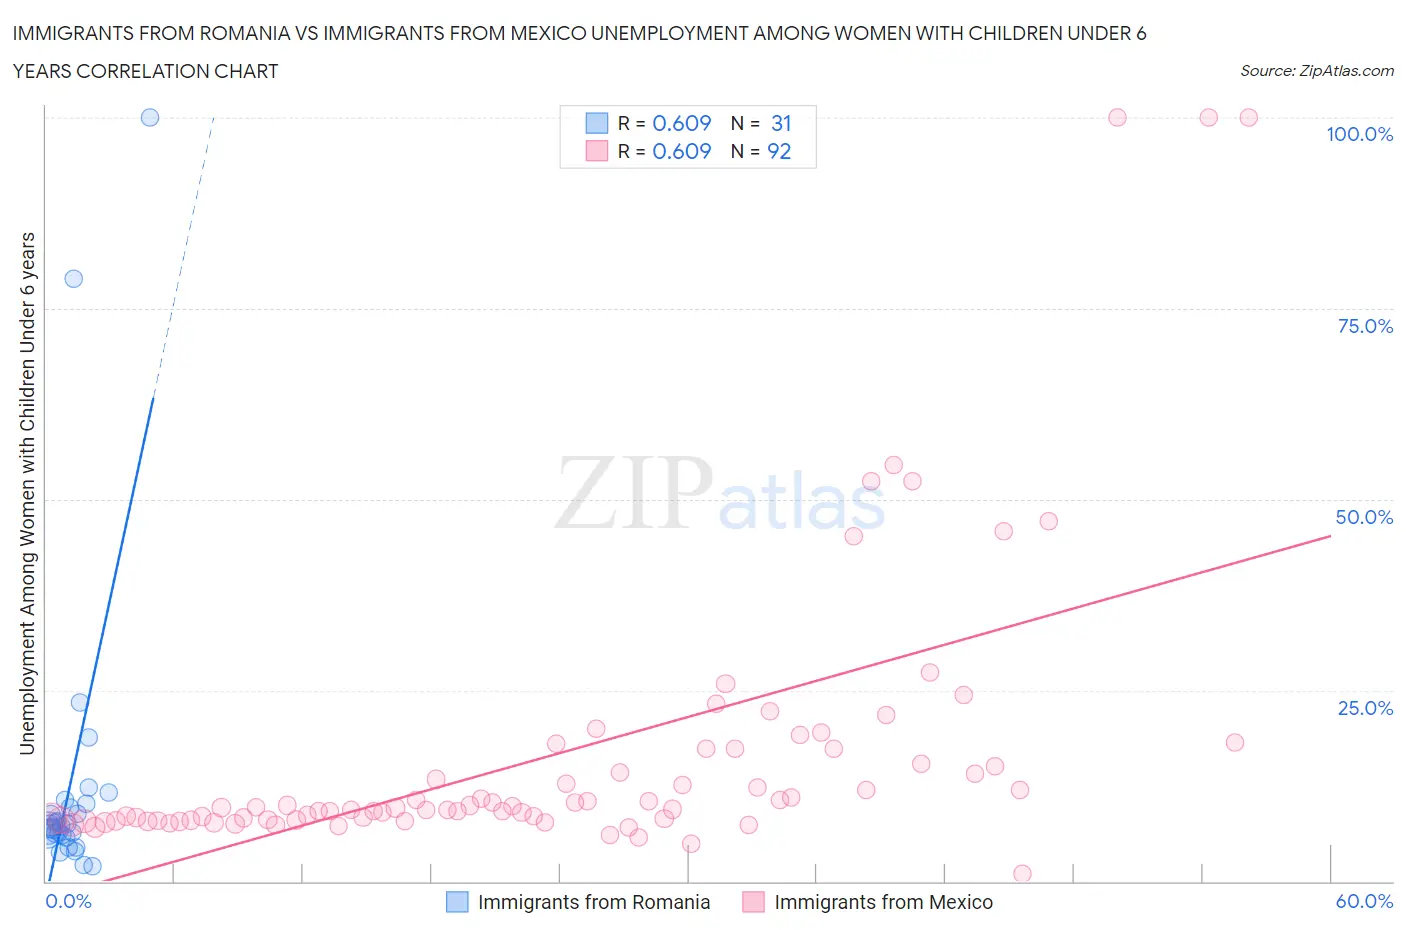
Immigrants from Romania vs Immigrants from Mexico Unemployment Among Women with Children Under 6 years Correlation Chart
The statistical analysis conducted on geographies consisting of 209,184,767 people shows a significant positive correlation between the proportion of Immigrants from Romania and unemployment rate among women with children under the age of 6 in the United States with a correlation coefficient (R) of 0.609 and weighted average of 7.1%. Similarly, the statistical analysis conducted on geographies consisting of 361,066,070 people shows a significant positive correlation between the proportion of Immigrants from Mexico and unemployment rate among women with children under the age of 6 in the United States with a correlation coefficient (R) of 0.609 and weighted average of 9.1%, a difference of 27.5%.
Unemployment Among Women with Children Under 6 years Correlation Summary
| Measurement | Immigrants from Romania | Immigrants from Mexico |
| Minimum | 1.9% | 1.0% |
| Maximum | 100.0% | 100.0% |
| Range | 98.1% | 99.0% |
| Mean | 13.2% | 16.5% |
| Median | 7.1% | 9.6% |
| Interquartile 25% (IQ1) | 6.1% | 8.0% |
| Interquartile 75% (IQ3) | 10.1% | 16.4% |
| Interquartile Range (IQR) | 4.0% | 8.4% |
| Standard Deviation (Sample) | 21.0% | 18.8% |
| Standard Deviation (Population) | 20.6% | 18.7% |
Similar Demographics by Unemployment Among Women with Children Under 6 years
Demographics Similar to Immigrants from Romania by Unemployment Among Women with Children Under 6 years
In terms of unemployment among women with children under 6 years, the demographic groups most similar to Immigrants from Romania are Immigrants from Albania (7.1%, a difference of 0.040%), Egyptian (7.1%, a difference of 0.090%), Immigrants from Afghanistan (7.1%, a difference of 0.12%), Immigrants from Zimbabwe (7.1%, a difference of 0.13%), and Immigrants from Venezuela (7.1%, a difference of 0.27%).
| Demographics | Rating | Rank | Unemployment Among Women with Children Under 6 years |
| Immigrants | Somalia | 98.9 /100 | #78 | Exceptional 7.1% |
| Immigrants | Fiji | 98.9 /100 | #79 | Exceptional 7.1% |
| Immigrants | Greece | 98.9 /100 | #80 | Exceptional 7.1% |
| Immigrants | Venezuela | 98.8 /100 | #81 | Exceptional 7.1% |
| Immigrants | Afghanistan | 98.7 /100 | #82 | Exceptional 7.1% |
| Egyptians | 98.7 /100 | #83 | Exceptional 7.1% |
| Immigrants | Albania | 98.7 /100 | #84 | Exceptional 7.1% |
| Immigrants | Romania | 98.7 /100 | #85 | Exceptional 7.1% |
| Immigrants | Zimbabwe | 98.6 /100 | #86 | Exceptional 7.1% |
| Alsatians | 98.4 /100 | #87 | Exceptional 7.1% |
| Immigrants | Hungary | 98.3 /100 | #88 | Exceptional 7.1% |
| Immigrants | Denmark | 98.3 /100 | #89 | Exceptional 7.1% |
| Immigrants | Spain | 98.2 /100 | #90 | Exceptional 7.1% |
| Danes | 98.2 /100 | #91 | Exceptional 7.1% |
| Albanians | 98.0 /100 | #92 | Exceptional 7.2% |
Demographics Similar to Immigrants from Mexico by Unemployment Among Women with Children Under 6 years
In terms of unemployment among women with children under 6 years, the demographic groups most similar to Immigrants from Mexico are Immigrants from West Indies (9.0%, a difference of 0.14%), Hispanic or Latino (9.0%, a difference of 0.17%), Alaskan Athabascan (9.1%, a difference of 0.41%), Pueblo (9.1%, a difference of 0.58%), and Dominican (9.1%, a difference of 0.70%).
| Demographics | Rating | Rank | Unemployment Among Women with Children Under 6 years |
| Mexicans | 0.0 /100 | #297 | Tragic 8.9% |
| Tlingit-Haida | 0.0 /100 | #298 | Tragic 8.9% |
| Immigrants | Jamaica | 0.0 /100 | #299 | Tragic 8.9% |
| Creek | 0.0 /100 | #300 | Tragic 8.9% |
| Chickasaw | 0.0 /100 | #301 | Tragic 9.0% |
| Hispanics or Latinos | 0.0 /100 | #302 | Tragic 9.0% |
| Immigrants | West Indies | 0.0 /100 | #303 | Tragic 9.0% |
| Immigrants | Mexico | 0.0 /100 | #304 | Tragic 9.1% |
| Alaskan Athabascans | 0.0 /100 | #305 | Tragic 9.1% |
| Pueblo | 0.0 /100 | #306 | Tragic 9.1% |
| Dominicans | 0.0 /100 | #307 | Tragic 9.1% |
| Immigrants | Micronesia | 0.0 /100 | #308 | Tragic 9.1% |
| Africans | 0.0 /100 | #309 | Tragic 9.2% |
| Cajuns | 0.0 /100 | #310 | Tragic 9.2% |
| French American Indians | 0.0 /100 | #311 | Tragic 9.2% |