Immigrants from Philippines vs Slavic Unemployment Among Ages 30 to 34 years
COMPARE
Immigrants from Philippines
Slavic
Unemployment Among Ages 30 to 34 years
Unemployment Among Ages 30 to 34 years Comparison
Immigrants from Philippines
Slavs
5.7%
UNEMPLOYMENT AMONG AGES 30 TO 34 YEARS
11.5/ 100
METRIC RATING
208th/ 347
METRIC RANK
5.5%
UNEMPLOYMENT AMONG AGES 30 TO 34 YEARS
30.9/ 100
METRIC RATING
194th/ 347
METRIC RANK
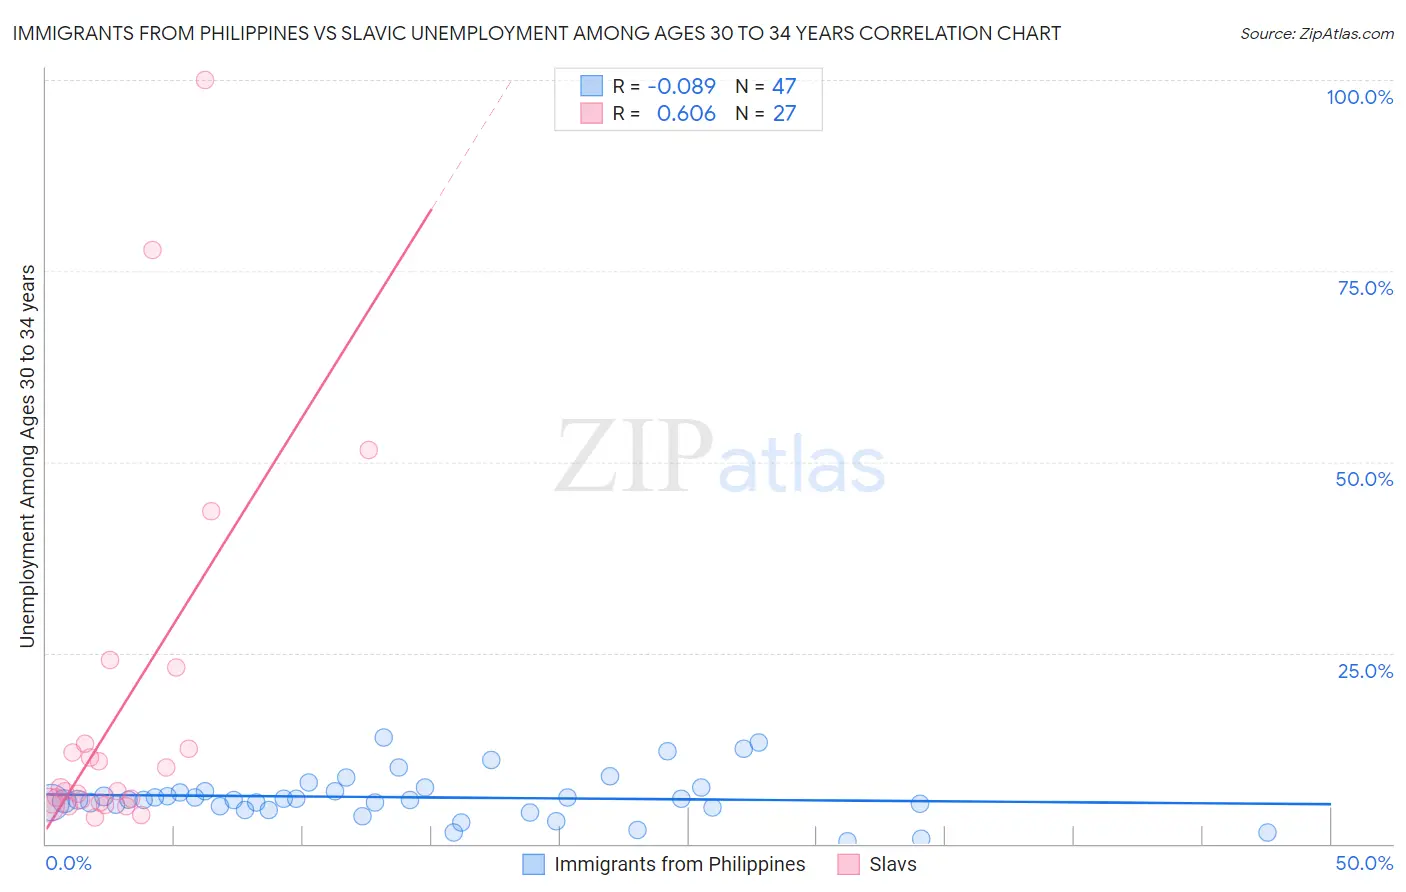
Immigrants from Philippines vs Slavic Unemployment Among Ages 30 to 34 years Correlation Chart
The statistical analysis conducted on geographies consisting of 437,048,228 people shows a slight negative correlation between the proportion of Immigrants from Philippines and unemployment rate among population between the ages 30 and 34 in the United States with a correlation coefficient (R) of -0.089 and weighted average of 5.7%. Similarly, the statistical analysis conducted on geographies consisting of 257,801,563 people shows a significant positive correlation between the proportion of Slavs and unemployment rate among population between the ages 30 and 34 in the United States with a correlation coefficient (R) of 0.606 and weighted average of 5.5%, a difference of 2.1%.
Unemployment Among Ages 30 to 34 years Correlation Summary
| Measurement | Immigrants from Philippines | Slavic |
| Minimum | 0.40% | 3.5% |
| Maximum | 14.0% | 100.0% |
| Range | 13.6% | 96.5% |
| Mean | 6.1% | 17.5% |
| Median | 5.8% | 6.9% |
| Interquartile 25% (IQ1) | 4.7% | 5.3% |
| Interquartile 75% (IQ3) | 6.9% | 13.0% |
| Interquartile Range (IQR) | 2.2% | 7.7% |
| Standard Deviation (Sample) | 3.0% | 23.8% |
| Standard Deviation (Population) | 3.0% | 23.4% |
Demographics Similar to Immigrants from Philippines and Slavs by Unemployment Among Ages 30 to 34 years
In terms of unemployment among ages 30 to 34 years, the demographic groups most similar to Immigrants from Philippines are French (5.7%, a difference of 0.12%), Israeli (5.6%, a difference of 0.21%), Alsatian (5.6%, a difference of 0.43%), White/Caucasian (5.7%, a difference of 0.43%), and Immigrants from Costa Rica (5.6%, a difference of 0.44%). Similarly, the demographic groups most similar to Slavs are Finnish (5.5%, a difference of 0.010%), Immigrants from Africa (5.5%, a difference of 0.020%), Irish (5.5%, a difference of 0.030%), Moroccan (5.5%, a difference of 0.030%), and Immigrants from South America (5.5%, a difference of 0.090%).
| Demographics | Rating | Rank | Unemployment Among Ages 30 to 34 years |
| Irish | 31.3 /100 | #191 | Fair 5.5% |
| Moroccans | 31.2 /100 | #192 | Fair 5.5% |
| Immigrants | Africa | 31.0 /100 | #193 | Fair 5.5% |
| Slavs | 30.9 /100 | #194 | Fair 5.5% |
| Finns | 30.7 /100 | #195 | Fair 5.5% |
| Immigrants | South America | 29.8 /100 | #196 | Fair 5.5% |
| Immigrants | Nicaragua | 28.9 /100 | #197 | Fair 5.5% |
| Immigrants | Afghanistan | 27.2 /100 | #198 | Fair 5.6% |
| Nicaraguans | 26.6 /100 | #199 | Fair 5.6% |
| Immigrants | Southern Europe | 25.8 /100 | #200 | Fair 5.6% |
| South American Indians | 24.4 /100 | #201 | Fair 5.6% |
| Immigrants | Germany | 22.9 /100 | #202 | Fair 5.6% |
| Koreans | 20.7 /100 | #203 | Fair 5.6% |
| Immigrants | Cameroon | 18.4 /100 | #204 | Poor 5.6% |
| Immigrants | Costa Rica | 14.4 /100 | #205 | Poor 5.6% |
| Alsatians | 14.3 /100 | #206 | Poor 5.6% |
| Israelis | 12.8 /100 | #207 | Poor 5.6% |
| Immigrants | Philippines | 11.5 /100 | #208 | Poor 5.7% |
| French | 10.8 /100 | #209 | Poor 5.7% |
| Whites/Caucasians | 9.2 /100 | #210 | Tragic 5.7% |
| Spanish American Indians | 8.7 /100 | #211 | Tragic 5.7% |