Immigrants from Panama vs Hispanic or Latino Male Unemployment
COMPARE
Immigrants from Panama
Hispanic or Latino
Male Unemployment
Male Unemployment Comparison
Immigrants from Panama
Hispanics or Latinos
5.6%
MALE UNEMPLOYMENT
1.8/ 100
METRIC RATING
227th/ 347
METRIC RANK
5.8%
MALE UNEMPLOYMENT
0.1/ 100
METRIC RATING
257th/ 347
METRIC RANK
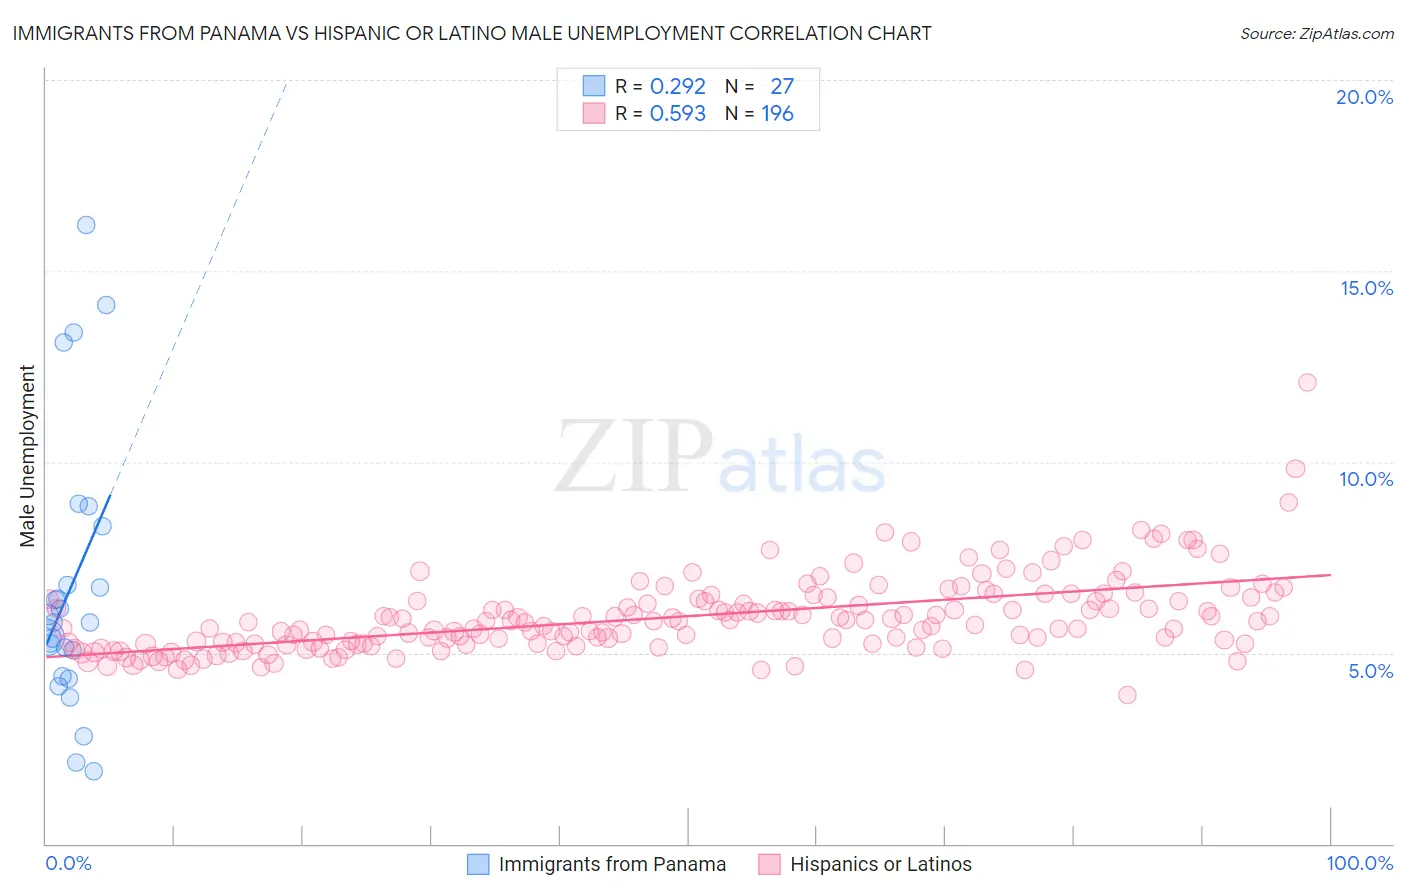
Immigrants from Panama vs Hispanic or Latino Male Unemployment Correlation Chart
The statistical analysis conducted on geographies consisting of 220,860,103 people shows a weak positive correlation between the proportion of Immigrants from Panama and unemployment rate among males in the United States with a correlation coefficient (R) of 0.292 and weighted average of 5.6%. Similarly, the statistical analysis conducted on geographies consisting of 562,173,025 people shows a substantial positive correlation between the proportion of Hispanics or Latinos and unemployment rate among males in the United States with a correlation coefficient (R) of 0.593 and weighted average of 5.8%, a difference of 3.5%.
Male Unemployment Correlation Summary
| Measurement | Immigrants from Panama | Hispanic or Latino |
| Minimum | 1.9% | 3.9% |
| Maximum | 16.2% | 12.1% |
| Range | 14.3% | 8.2% |
| Mean | 6.8% | 5.9% |
| Median | 5.8% | 5.8% |
| Interquartile 25% (IQ1) | 4.4% | 5.2% |
| Interquartile 75% (IQ3) | 8.3% | 6.4% |
| Interquartile Range (IQR) | 3.9% | 1.1% |
| Standard Deviation (Sample) | 3.6% | 1.0% |
| Standard Deviation (Population) | 3.6% | 1.0% |
Similar Demographics by Male Unemployment
Demographics Similar to Immigrants from Panama by Male Unemployment
In terms of male unemployment, the demographic groups most similar to Immigrants from Panama are Immigrants from Cambodia (5.6%, a difference of 0.0%), Seminole (5.6%, a difference of 0.020%), Central American (5.6%, a difference of 0.020%), Immigrants from Africa (5.6%, a difference of 0.060%), and Panamanian (5.6%, a difference of 0.090%).
| Demographics | Rating | Rank | Male Unemployment |
| Portuguese | 3.5 /100 | #220 | Tragic 5.6% |
| Soviet Union | 3.2 /100 | #221 | Tragic 5.6% |
| Immigrants | Micronesia | 2.9 /100 | #222 | Tragic 5.6% |
| Creek | 2.6 /100 | #223 | Tragic 5.6% |
| Cherokee | 2.4 /100 | #224 | Tragic 5.6% |
| Panamanians | 1.9 /100 | #225 | Tragic 5.6% |
| Immigrants | Cambodia | 1.8 /100 | #226 | Tragic 5.6% |
| Immigrants | Panama | 1.8 /100 | #227 | Tragic 5.6% |
| Seminole | 1.8 /100 | #228 | Tragic 5.6% |
| Central Americans | 1.8 /100 | #229 | Tragic 5.6% |
| Immigrants | Africa | 1.7 /100 | #230 | Tragic 5.6% |
| Choctaw | 1.6 /100 | #231 | Tragic 5.6% |
| Moroccans | 1.6 /100 | #232 | Tragic 5.6% |
| Somalis | 1.5 /100 | #233 | Tragic 5.6% |
| Immigrants | Somalia | 1.5 /100 | #234 | Tragic 5.6% |
Demographics Similar to Hispanics or Latinos by Male Unemployment
In terms of male unemployment, the demographic groups most similar to Hispanics or Latinos are Dutch West Indian (5.8%, a difference of 0.14%), Comanche (5.8%, a difference of 0.17%), Kiowa (5.8%, a difference of 0.25%), Cajun (5.8%, a difference of 0.29%), and Japanese (5.8%, a difference of 0.35%).
| Demographics | Rating | Rank | Male Unemployment |
| Immigrants | Bahamas | 0.4 /100 | #250 | Tragic 5.7% |
| Spanish Americans | 0.3 /100 | #251 | Tragic 5.7% |
| Mexicans | 0.2 /100 | #252 | Tragic 5.8% |
| Mexican American Indians | 0.2 /100 | #253 | Tragic 5.8% |
| Japanese | 0.2 /100 | #254 | Tragic 5.8% |
| Kiowa | 0.2 /100 | #255 | Tragic 5.8% |
| Comanche | 0.2 /100 | #256 | Tragic 5.8% |
| Hispanics or Latinos | 0.1 /100 | #257 | Tragic 5.8% |
| Dutch West Indians | 0.1 /100 | #258 | Tragic 5.8% |
| Cajuns | 0.1 /100 | #259 | Tragic 5.8% |
| Immigrants | Central America | 0.1 /100 | #260 | Tragic 5.8% |
| Liberians | 0.1 /100 | #261 | Tragic 5.8% |
| Immigrants | Portugal | 0.1 /100 | #262 | Tragic 5.9% |
| Immigrants | Latin America | 0.1 /100 | #263 | Tragic 5.9% |
| Immigrants | Mexico | 0.0 /100 | #264 | Tragic 5.9% |