Immigrants from Panama vs Immigrants from Cabo Verde Unemployment Among Women with Children Under 6 years
COMPARE
Immigrants from Panama
Immigrants from Cabo Verde
Unemployment Among Women with Children Under 6 years
Unemployment Among Women with Children Under 6 years Comparison
Immigrants from Panama
Immigrants from Cabo Verde
7.7%
UNEMPLOYMENT AMONG WOMEN WITH CHILDREN UNDER 6 YEARS
35.7/ 100
METRIC RATING
189th/ 347
METRIC RANK
5.4%
UNEMPLOYMENT AMONG WOMEN WITH CHILDREN UNDER 6 YEARS
100.0/ 100
METRIC RATING
1st/ 347
METRIC RANK
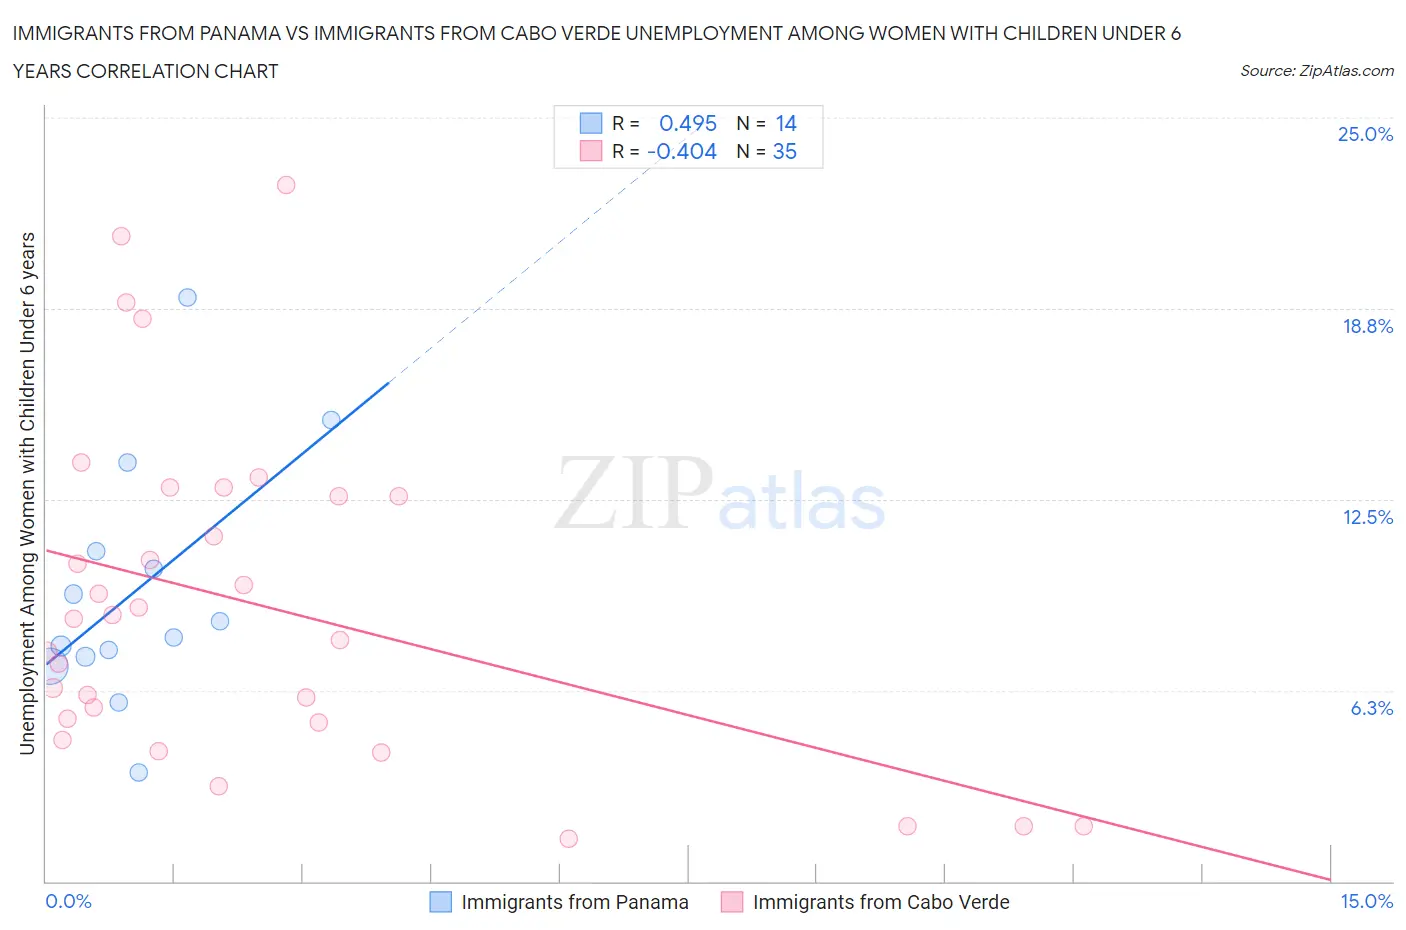
Immigrants from Panama vs Immigrants from Cabo Verde Unemployment Among Women with Children Under 6 years Correlation Chart
The statistical analysis conducted on geographies consisting of 188,916,649 people shows a moderate positive correlation between the proportion of Immigrants from Panama and unemployment rate among women with children under the age of 6 in the United States with a correlation coefficient (R) of 0.495 and weighted average of 7.7%. Similarly, the statistical analysis conducted on geographies consisting of 34,461,767 people shows a moderate negative correlation between the proportion of Immigrants from Cabo Verde and unemployment rate among women with children under the age of 6 in the United States with a correlation coefficient (R) of -0.404 and weighted average of 5.4%, a difference of 43.3%.
Unemployment Among Women with Children Under 6 years Correlation Summary
| Measurement | Immigrants from Panama | Immigrants from Cabo Verde |
| Minimum | 3.5% | 1.4% |
| Maximum | 19.1% | 22.8% |
| Range | 15.6% | 21.4% |
| Mean | 9.6% | 9.1% |
| Median | 8.2% | 8.6% |
| Interquartile 25% (IQ1) | 7.3% | 5.2% |
| Interquartile 75% (IQ3) | 10.8% | 12.6% |
| Interquartile Range (IQR) | 3.4% | 7.4% |
| Standard Deviation (Sample) | 4.0% | 5.5% |
| Standard Deviation (Population) | 3.9% | 5.4% |
Similar Demographics by Unemployment Among Women with Children Under 6 years
Demographics Similar to Immigrants from Panama by Unemployment Among Women with Children Under 6 years
In terms of unemployment among women with children under 6 years, the demographic groups most similar to Immigrants from Panama are Immigrants from North Macedonia (7.7%, a difference of 0.090%), Immigrants from Thailand (7.7%, a difference of 0.20%), Czechoslovakian (7.7%, a difference of 0.20%), Immigrants from Austria (7.7%, a difference of 0.24%), and Immigrants from Africa (7.7%, a difference of 0.24%).
| Demographics | Rating | Rank | Unemployment Among Women with Children Under 6 years |
| Nepalese | 43.5 /100 | #182 | Average 7.7% |
| Sierra Leoneans | 42.9 /100 | #183 | Average 7.7% |
| Indonesians | 40.5 /100 | #184 | Average 7.7% |
| Spanish Americans | 39.7 /100 | #185 | Fair 7.7% |
| Yugoslavians | 39.4 /100 | #186 | Fair 7.7% |
| Immigrants | Thailand | 38.5 /100 | #187 | Fair 7.7% |
| Czechoslovakians | 38.4 /100 | #188 | Fair 7.7% |
| Immigrants | Panama | 35.7 /100 | #189 | Fair 7.7% |
| Immigrants | North Macedonia | 34.4 /100 | #190 | Fair 7.7% |
| Immigrants | Austria | 32.4 /100 | #191 | Fair 7.7% |
| Immigrants | Africa | 32.4 /100 | #192 | Fair 7.7% |
| Slavs | 32.4 /100 | #193 | Fair 7.7% |
| Syrians | 31.9 /100 | #194 | Fair 7.7% |
| Malaysians | 31.1 /100 | #195 | Fair 7.7% |
| Immigrants | St. Vincent and the Grenadines | 31.1 /100 | #196 | Fair 7.7% |
Demographics Similar to Immigrants from Cabo Verde by Unemployment Among Women with Children Under 6 years
In terms of unemployment among women with children under 6 years, the demographic groups most similar to Immigrants from Cabo Verde are Immigrants from Hong Kong (5.8%, a difference of 7.4%), Okinawan (5.8%, a difference of 8.3%), Cambodian (5.9%, a difference of 9.3%), Cape Verdean (5.9%, a difference of 10.4%), and Immigrants from Taiwan (6.0%, a difference of 12.3%).
| Demographics | Rating | Rank | Unemployment Among Women with Children Under 6 years |
| Immigrants | Cabo Verde | 100.0 /100 | #1 | Exceptional 5.4% |
| Immigrants | Hong Kong | 100.0 /100 | #2 | Exceptional 5.8% |
| Okinawans | 100.0 /100 | #3 | Exceptional 5.8% |
| Cambodians | 100.0 /100 | #4 | Exceptional 5.9% |
| Cape Verdeans | 100.0 /100 | #5 | Exceptional 5.9% |
| Immigrants | Taiwan | 100.0 /100 | #6 | Exceptional 6.0% |
| Taiwanese | 100.0 /100 | #7 | Exceptional 6.1% |
| Immigrants | India | 100.0 /100 | #8 | Exceptional 6.1% |
| Filipinos | 100.0 /100 | #9 | Exceptional 6.1% |
| Immigrants | China | 100.0 /100 | #10 | Exceptional 6.2% |
| Indians (Asian) | 100.0 /100 | #11 | Exceptional 6.3% |
| Immigrants | Singapore | 100.0 /100 | #12 | Exceptional 6.3% |
| Immigrants | Eastern Asia | 100.0 /100 | #13 | Exceptional 6.3% |
| Immigrants | Bulgaria | 100.0 /100 | #14 | Exceptional 6.3% |
| Thais | 100.0 /100 | #15 | Exceptional 6.3% |