Immigrants from Northern Europe vs Immigrants from Iran Unemployment Among Ages 25 to 29 years
COMPARE
Immigrants from Northern Europe
Immigrants from Iran
Unemployment Among Ages 25 to 29 years
Unemployment Among Ages 25 to 29 years Comparison
Immigrants from Northern Europe
Immigrants from Iran
6.6%
UNEMPLOYMENT AMONG AGES 25 TO 29 YEARS
57.3/ 100
METRIC RATING
166th/ 347
METRIC RANK
6.7%
UNEMPLOYMENT AMONG AGES 25 TO 29 YEARS
34.4/ 100
METRIC RATING
186th/ 347
METRIC RANK
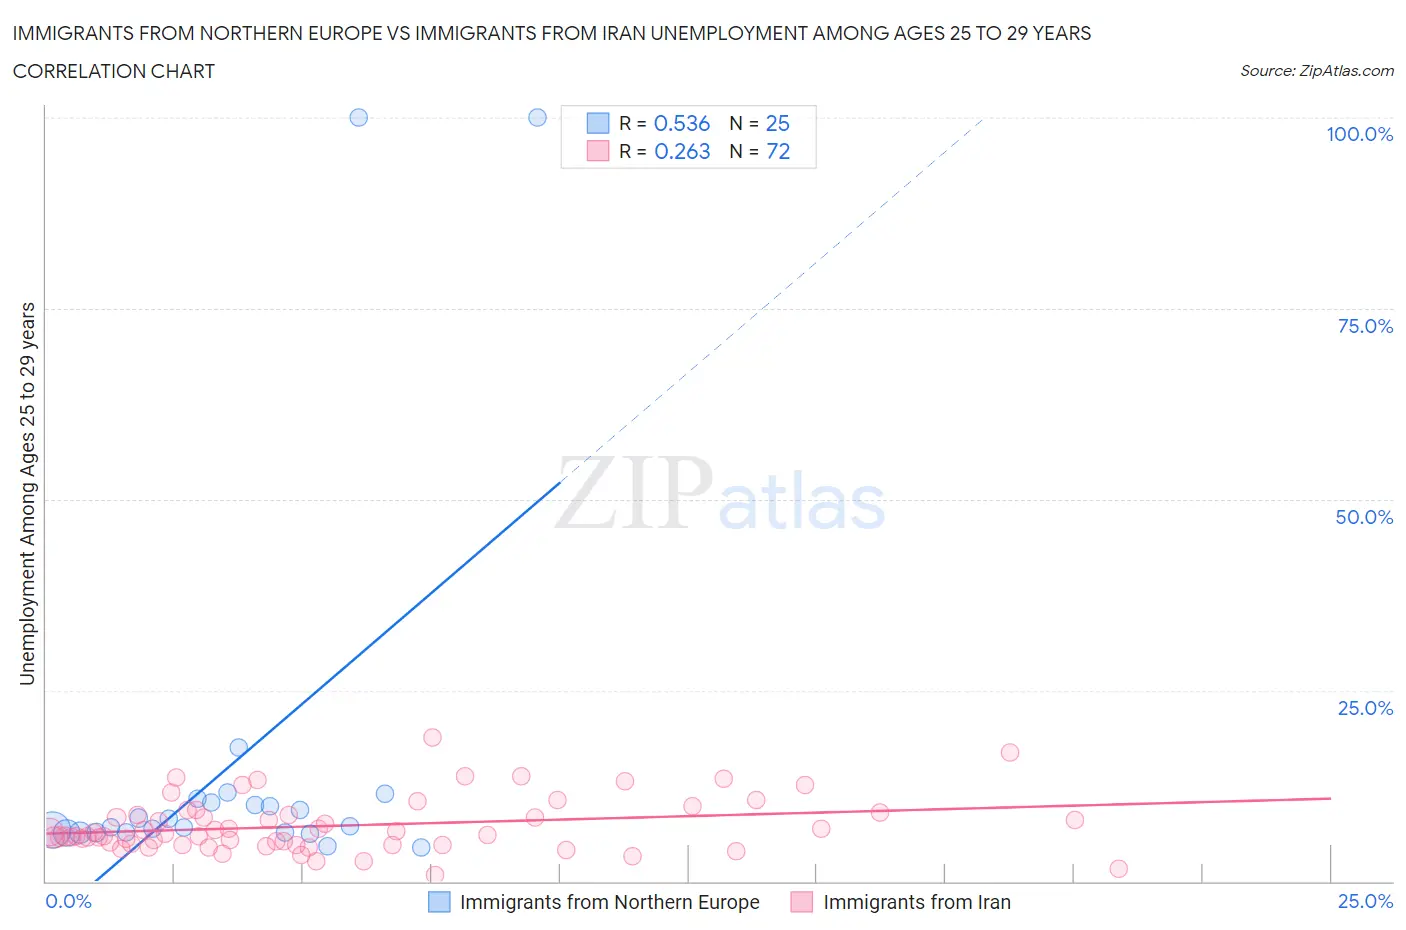
Immigrants from Northern Europe vs Immigrants from Iran Unemployment Among Ages 25 to 29 years Correlation Chart
The statistical analysis conducted on geographies consisting of 443,526,029 people shows a substantial positive correlation between the proportion of Immigrants from Northern Europe and unemployment rate among population between the ages 25 and 29 in the United States with a correlation coefficient (R) of 0.536 and weighted average of 6.6%. Similarly, the statistical analysis conducted on geographies consisting of 271,354,448 people shows a weak positive correlation between the proportion of Immigrants from Iran and unemployment rate among population between the ages 25 and 29 in the United States with a correlation coefficient (R) of 0.263 and weighted average of 6.7%, a difference of 1.5%.
Unemployment Among Ages 25 to 29 years Correlation Summary
| Measurement | Immigrants from Northern Europe | Immigrants from Iran |
| Minimum | 4.5% | 0.80% |
| Maximum | 100.0% | 18.9% |
| Range | 95.5% | 18.1% |
| Mean | 15.6% | 7.3% |
| Median | 7.2% | 6.1% |
| Interquartile 25% (IQ1) | 6.4% | 4.9% |
| Interquartile 75% (IQ3) | 10.6% | 8.9% |
| Interquartile Range (IQR) | 4.3% | 4.0% |
| Standard Deviation (Sample) | 25.6% | 3.5% |
| Standard Deviation (Population) | 25.0% | 3.5% |
Demographics Similar to Immigrants from Northern Europe and Immigrants from Iran by Unemployment Among Ages 25 to 29 years
In terms of unemployment among ages 25 to 29 years, the demographic groups most similar to Immigrants from Northern Europe are Immigrants from Canada (6.6%, a difference of 0.14%), Estonian (6.6%, a difference of 0.16%), South American (6.6%, a difference of 0.18%), Albanian (6.6%, a difference of 0.24%), and Immigrants from Cambodia (6.6%, a difference of 0.30%). Similarly, the demographic groups most similar to Immigrants from Iran are Moroccan (6.7%, a difference of 0.10%), Immigrants from Costa Rica (6.7%, a difference of 0.26%), Immigrants from Scotland (6.7%, a difference of 0.34%), Czechoslovakian (6.7%, a difference of 0.41%), and Immigrants from Africa (6.7%, a difference of 0.43%).
| Demographics | Rating | Rank | Unemployment Among Ages 25 to 29 years |
| Immigrants | Northern Europe | 57.3 /100 | #166 | Average 6.6% |
| Immigrants | Canada | 55.0 /100 | #167 | Average 6.6% |
| Estonians | 54.8 /100 | #168 | Average 6.6% |
| South Americans | 54.5 /100 | #169 | Average 6.6% |
| Albanians | 53.5 /100 | #170 | Average 6.6% |
| Immigrants | Cambodia | 52.6 /100 | #171 | Average 6.6% |
| Bangladeshis | 51.6 /100 | #172 | Average 6.6% |
| Russians | 51.3 /100 | #173 | Average 6.6% |
| Immigrants | North America | 50.0 /100 | #174 | Average 6.6% |
| Immigrants | South Eastern Asia | 49.1 /100 | #175 | Average 6.7% |
| Osage | 48.1 /100 | #176 | Average 6.7% |
| Immigrants | Israel | 47.8 /100 | #177 | Average 6.7% |
| Immigrants | Iraq | 45.1 /100 | #178 | Average 6.7% |
| Costa Ricans | 44.9 /100 | #179 | Average 6.7% |
| Immigrants | Africa | 41.1 /100 | #180 | Average 6.7% |
| Immigrants | Western Europe | 41.1 /100 | #181 | Average 6.7% |
| Czechoslovakians | 40.7 /100 | #182 | Average 6.7% |
| Immigrants | Scotland | 39.6 /100 | #183 | Fair 6.7% |
| Immigrants | Costa Rica | 38.3 /100 | #184 | Fair 6.7% |
| Moroccans | 35.9 /100 | #185 | Fair 6.7% |
| Immigrants | Iran | 34.4 /100 | #186 | Fair 6.7% |