Immigrants from Northern Europe vs Eastern European Male Unemployment
COMPARE
Immigrants from Northern Europe
Eastern European
Male Unemployment
Male Unemployment Comparison
Immigrants from Northern Europe
Eastern Europeans
5.0%
MALE UNEMPLOYMENT
96.4/ 100
METRIC RATING
78th/ 347
METRIC RANK
5.0%
MALE UNEMPLOYMENT
97.9/ 100
METRIC RATING
63rd/ 347
METRIC RANK
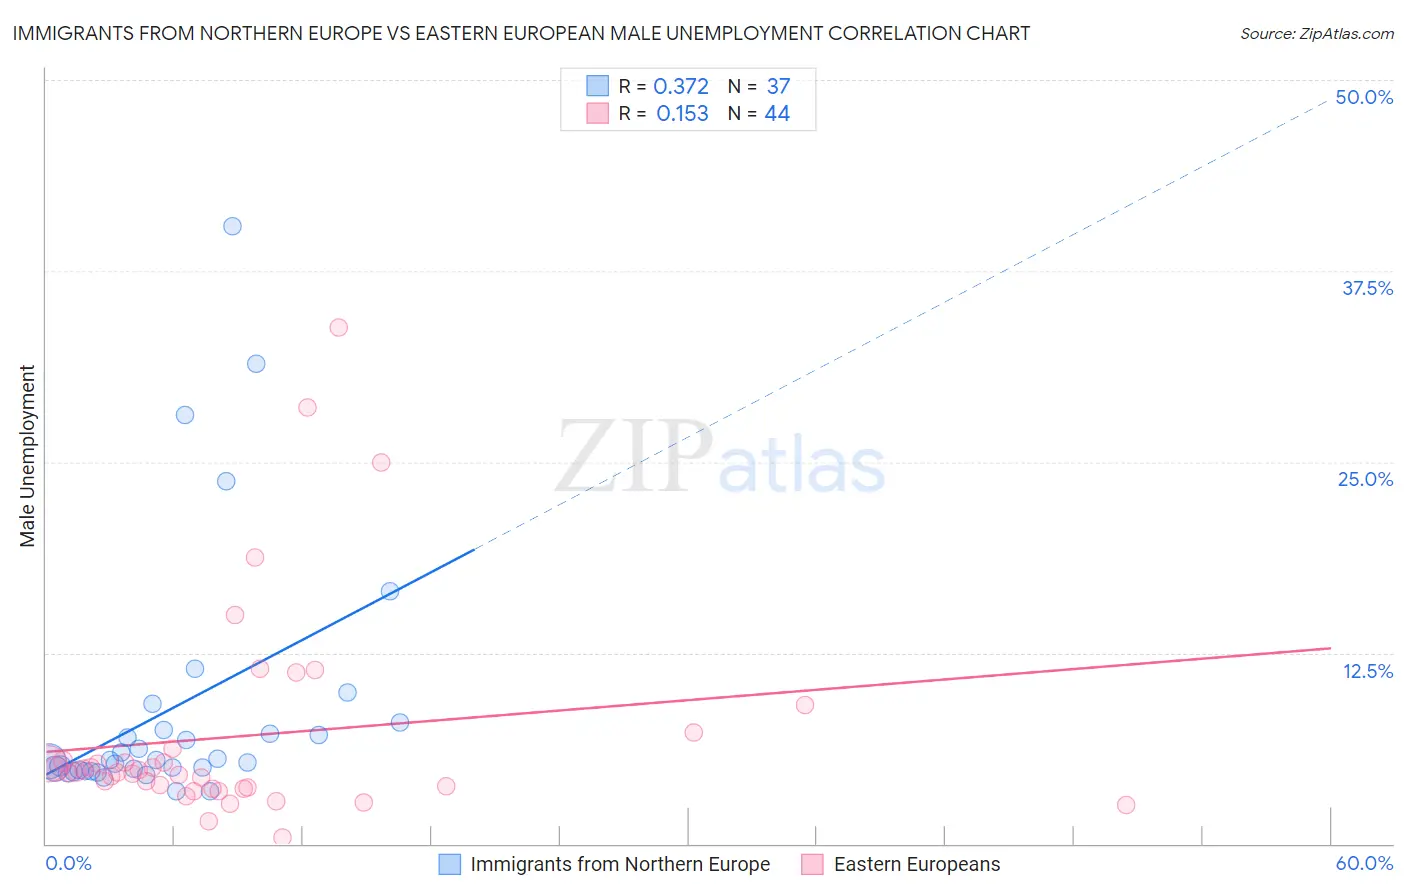
Immigrants from Northern Europe vs Eastern European Male Unemployment Correlation Chart
The statistical analysis conducted on geographies consisting of 473,701,130 people shows a mild positive correlation between the proportion of Immigrants from Northern Europe and unemployment rate among males in the United States with a correlation coefficient (R) of 0.372 and weighted average of 5.0%. Similarly, the statistical analysis conducted on geographies consisting of 457,878,512 people shows a poor positive correlation between the proportion of Eastern Europeans and unemployment rate among males in the United States with a correlation coefficient (R) of 0.153 and weighted average of 5.0%, a difference of 0.84%.
Male Unemployment Correlation Summary
| Measurement | Immigrants from Northern Europe | Eastern European |
| Minimum | 3.4% | 0.41% |
| Maximum | 40.4% | 33.8% |
| Range | 37.0% | 33.4% |
| Mean | 8.9% | 7.0% |
| Median | 5.5% | 4.7% |
| Interquartile 25% (IQ1) | 4.8% | 3.6% |
| Interquartile 75% (IQ3) | 7.7% | 5.8% |
| Interquartile Range (IQR) | 2.9% | 2.2% |
| Standard Deviation (Sample) | 8.4% | 7.0% |
| Standard Deviation (Population) | 8.3% | 6.9% |
Demographics Similar to Immigrants from Northern Europe and Eastern Europeans by Male Unemployment
In terms of male unemployment, the demographic groups most similar to Immigrants from Northern Europe are Iranian (5.0%, a difference of 0.010%), South African (5.0%, a difference of 0.010%), Immigrants from Sudan (5.0%, a difference of 0.060%), Argentinean (5.0%, a difference of 0.060%), and Assyrian/Chaldean/Syriac (5.0%, a difference of 0.22%). Similarly, the demographic groups most similar to Eastern Europeans are Basque (5.0%, a difference of 0.010%), Celtic (5.0%, a difference of 0.020%), Cambodian (5.0%, a difference of 0.14%), Icelander (5.0%, a difference of 0.18%), and Immigrants from Argentina (5.0%, a difference of 0.22%).
| Demographics | Rating | Rank | Male Unemployment |
| Immigrants | Argentina | 98.1 /100 | #60 | Exceptional 5.0% |
| Cambodians | 98.1 /100 | #61 | Exceptional 5.0% |
| Basques | 97.9 /100 | #62 | Exceptional 5.0% |
| Eastern Europeans | 97.9 /100 | #63 | Exceptional 5.0% |
| Celtics | 97.8 /100 | #64 | Exceptional 5.0% |
| Icelanders | 97.6 /100 | #65 | Exceptional 5.0% |
| Finns | 97.5 /100 | #66 | Exceptional 5.0% |
| Immigrants | Canada | 97.5 /100 | #67 | Exceptional 5.0% |
| Australians | 97.4 /100 | #68 | Exceptional 5.0% |
| Immigrants | Sweden | 97.4 /100 | #69 | Exceptional 5.0% |
| Whites/Caucasians | 97.3 /100 | #70 | Exceptional 5.0% |
| New Zealanders | 97.3 /100 | #71 | Exceptional 5.0% |
| Immigrants | South Africa | 97.1 /100 | #72 | Exceptional 5.0% |
| Greeks | 97.0 /100 | #73 | Exceptional 5.0% |
| Immigrants | North America | 96.9 /100 | #74 | Exceptional 5.0% |
| Assyrians/Chaldeans/Syriacs | 96.9 /100 | #75 | Exceptional 5.0% |
| Immigrants | Sudan | 96.5 /100 | #76 | Exceptional 5.0% |
| Iranians | 96.4 /100 | #77 | Exceptional 5.0% |
| Immigrants | Northern Europe | 96.4 /100 | #78 | Exceptional 5.0% |
| South Africans | 96.4 /100 | #79 | Exceptional 5.0% |
| Argentineans | 96.2 /100 | #80 | Exceptional 5.0% |