Comanche vs Eastern European Male Unemployment
COMPARE
Comanche
Eastern European
Male Unemployment
Male Unemployment Comparison
Comanche
Eastern Europeans
5.8%
MALE UNEMPLOYMENT
0.2/ 100
METRIC RATING
256th/ 347
METRIC RANK
5.0%
MALE UNEMPLOYMENT
97.9/ 100
METRIC RATING
63rd/ 347
METRIC RANK
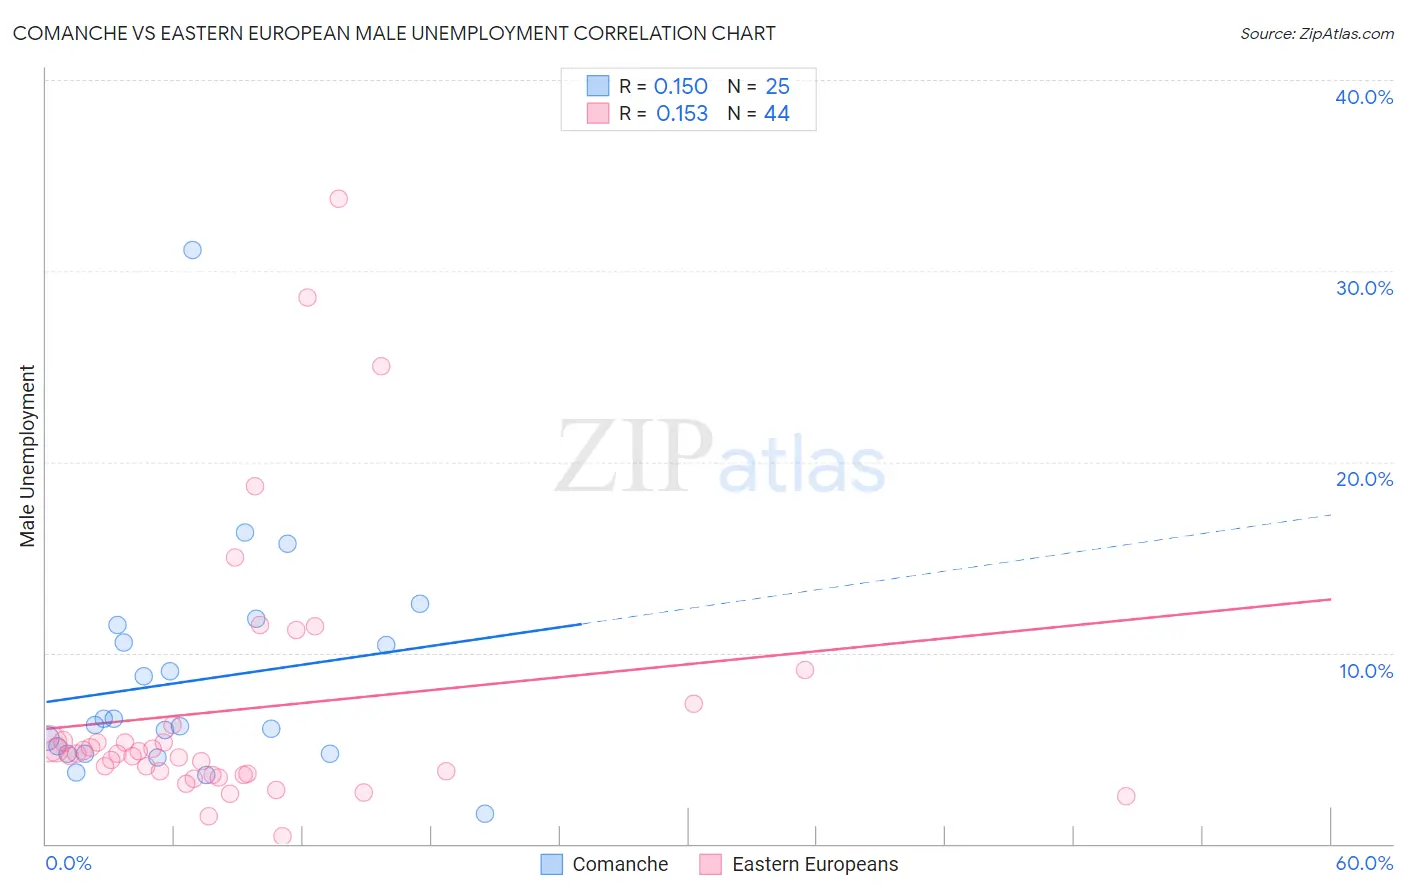
Comanche vs Eastern European Male Unemployment Correlation Chart
The statistical analysis conducted on geographies consisting of 109,543,085 people shows a poor positive correlation between the proportion of Comanche and unemployment rate among males in the United States with a correlation coefficient (R) of 0.150 and weighted average of 5.8%. Similarly, the statistical analysis conducted on geographies consisting of 457,878,512 people shows a poor positive correlation between the proportion of Eastern Europeans and unemployment rate among males in the United States with a correlation coefficient (R) of 0.153 and weighted average of 5.0%, a difference of 15.9%.
Male Unemployment Correlation Summary
| Measurement | Comanche | Eastern European |
| Minimum | 1.6% | 0.41% |
| Maximum | 31.1% | 33.8% |
| Range | 29.5% | 33.4% |
| Mean | 8.5% | 7.0% |
| Median | 6.2% | 4.7% |
| Interquartile 25% (IQ1) | 4.7% | 3.6% |
| Interquartile 75% (IQ3) | 11.0% | 5.8% |
| Interquartile Range (IQR) | 6.3% | 2.2% |
| Standard Deviation (Sample) | 6.0% | 7.0% |
| Standard Deviation (Population) | 5.9% | 6.9% |
Similar Demographics by Male Unemployment
Demographics Similar to Comanche by Male Unemployment
In terms of male unemployment, the demographic groups most similar to Comanche are Kiowa (5.8%, a difference of 0.080%), Hispanic or Latino (5.8%, a difference of 0.17%), Japanese (5.8%, a difference of 0.18%), Dutch West Indian (5.8%, a difference of 0.30%), and Mexican American Indian (5.8%, a difference of 0.35%).
| Demographics | Rating | Rank | Male Unemployment |
| Cree | 0.4 /100 | #249 | Tragic 5.7% |
| Immigrants | Bahamas | 0.4 /100 | #250 | Tragic 5.7% |
| Spanish Americans | 0.3 /100 | #251 | Tragic 5.7% |
| Mexicans | 0.2 /100 | #252 | Tragic 5.8% |
| Mexican American Indians | 0.2 /100 | #253 | Tragic 5.8% |
| Japanese | 0.2 /100 | #254 | Tragic 5.8% |
| Kiowa | 0.2 /100 | #255 | Tragic 5.8% |
| Comanche | 0.2 /100 | #256 | Tragic 5.8% |
| Hispanics or Latinos | 0.1 /100 | #257 | Tragic 5.8% |
| Dutch West Indians | 0.1 /100 | #258 | Tragic 5.8% |
| Cajuns | 0.1 /100 | #259 | Tragic 5.8% |
| Immigrants | Central America | 0.1 /100 | #260 | Tragic 5.8% |
| Liberians | 0.1 /100 | #261 | Tragic 5.8% |
| Immigrants | Portugal | 0.1 /100 | #262 | Tragic 5.9% |
| Immigrants | Latin America | 0.1 /100 | #263 | Tragic 5.9% |
Demographics Similar to Eastern Europeans by Male Unemployment
In terms of male unemployment, the demographic groups most similar to Eastern Europeans are Basque (5.0%, a difference of 0.010%), Celtic (5.0%, a difference of 0.020%), Cambodian (5.0%, a difference of 0.14%), Icelander (5.0%, a difference of 0.18%), and Immigrants from Argentina (5.0%, a difference of 0.22%).
| Demographics | Rating | Rank | Male Unemployment |
| Immigrants | Bulgaria | 98.7 /100 | #56 | Exceptional 5.0% |
| Turks | 98.5 /100 | #57 | Exceptional 5.0% |
| Lithuanians | 98.5 /100 | #58 | Exceptional 5.0% |
| Immigrants | Netherlands | 98.3 /100 | #59 | Exceptional 5.0% |
| Immigrants | Argentina | 98.1 /100 | #60 | Exceptional 5.0% |
| Cambodians | 98.1 /100 | #61 | Exceptional 5.0% |
| Basques | 97.9 /100 | #62 | Exceptional 5.0% |
| Eastern Europeans | 97.9 /100 | #63 | Exceptional 5.0% |
| Celtics | 97.8 /100 | #64 | Exceptional 5.0% |
| Icelanders | 97.6 /100 | #65 | Exceptional 5.0% |
| Finns | 97.5 /100 | #66 | Exceptional 5.0% |
| Immigrants | Canada | 97.5 /100 | #67 | Exceptional 5.0% |
| Australians | 97.4 /100 | #68 | Exceptional 5.0% |
| Immigrants | Sweden | 97.4 /100 | #69 | Exceptional 5.0% |
| Whites/Caucasians | 97.3 /100 | #70 | Exceptional 5.0% |