Immigrants from North Macedonia vs Turkish Female Unemployment
COMPARE
Immigrants from North Macedonia
Turkish
Female Unemployment
Female Unemployment Comparison
Immigrants from North Macedonia
Turks
5.1%
FEMALE UNEMPLOYMENT
88.3/ 100
METRIC RATING
119th/ 347
METRIC RANK
5.0%
FEMALE UNEMPLOYMENT
97.6/ 100
METRIC RATING
79th/ 347
METRIC RANK
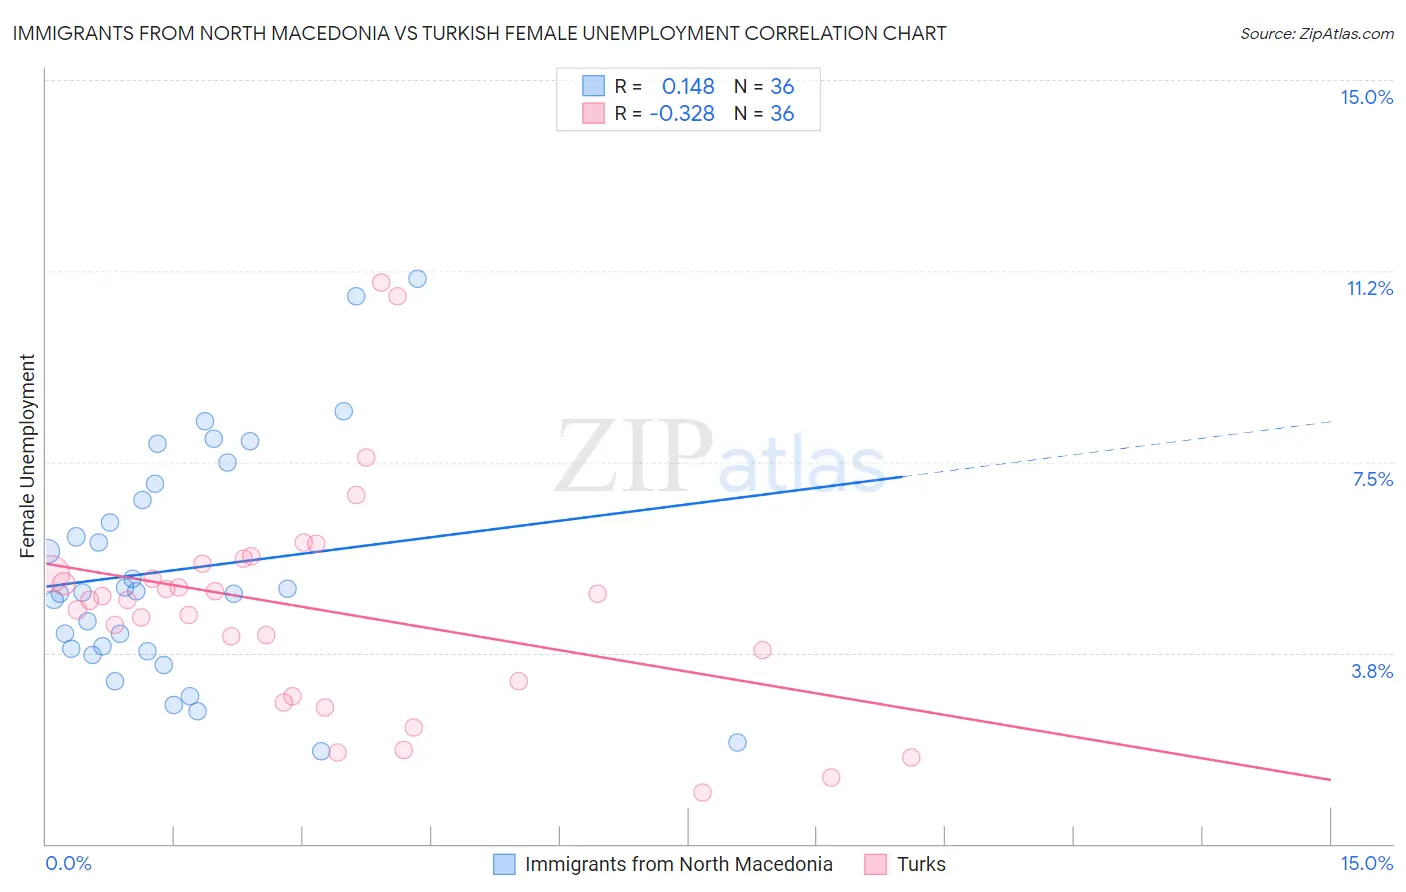
Immigrants from North Macedonia vs Turkish Female Unemployment Correlation Chart
The statistical analysis conducted on geographies consisting of 74,255,623 people shows a poor positive correlation between the proportion of Immigrants from North Macedonia and unemploymnet rate among females in the United States with a correlation coefficient (R) of 0.148 and weighted average of 5.1%. Similarly, the statistical analysis conducted on geographies consisting of 271,277,320 people shows a mild negative correlation between the proportion of Turks and unemploymnet rate among females in the United States with a correlation coefficient (R) of -0.328 and weighted average of 5.0%, a difference of 2.7%.
Female Unemployment Correlation Summary
| Measurement | Immigrants from North Macedonia | Turkish |
| Minimum | 1.8% | 1.0% |
| Maximum | 11.1% | 11.0% |
| Range | 9.3% | 10.0% |
| Mean | 5.4% | 4.6% |
| Median | 4.9% | 4.8% |
| Interquartile 25% (IQ1) | 3.8% | 3.0% |
| Interquartile 75% (IQ3) | 6.9% | 5.4% |
| Interquartile Range (IQR) | 3.1% | 2.3% |
| Standard Deviation (Sample) | 2.3% | 2.2% |
| Standard Deviation (Population) | 2.2% | 2.2% |
Similar Demographics by Female Unemployment
Demographics Similar to Immigrants from North Macedonia by Female Unemployment
In terms of female unemployment, the demographic groups most similar to Immigrants from North Macedonia are Immigrants from Romania (5.1%, a difference of 0.020%), Immigrants from Western Europe (5.1%, a difference of 0.030%), Immigrants from Germany (5.1%, a difference of 0.10%), Immigrants from South Africa (5.1%, a difference of 0.10%), and Immigrants from Europe (5.1%, a difference of 0.15%).
| Demographics | Rating | Rank | Female Unemployment |
| Estonians | 92.1 /100 | #112 | Exceptional 5.1% |
| Immigrants | Saudi Arabia | 91.2 /100 | #113 | Exceptional 5.1% |
| Immigrants | Turkey | 91.0 /100 | #114 | Exceptional 5.1% |
| Lebanese | 91.0 /100 | #115 | Exceptional 5.1% |
| Americans | 90.5 /100 | #116 | Exceptional 5.1% |
| Jordanians | 90.3 /100 | #117 | Exceptional 5.1% |
| Immigrants | Croatia | 89.9 /100 | #118 | Excellent 5.1% |
| Immigrants | North Macedonia | 88.3 /100 | #119 | Excellent 5.1% |
| Immigrants | Romania | 88.1 /100 | #120 | Excellent 5.1% |
| Immigrants | Western Europe | 88.1 /100 | #121 | Excellent 5.1% |
| Immigrants | Germany | 87.6 /100 | #122 | Excellent 5.1% |
| Immigrants | South Africa | 87.6 /100 | #123 | Excellent 5.1% |
| Immigrants | Europe | 87.2 /100 | #124 | Excellent 5.1% |
| Basques | 86.5 /100 | #125 | Excellent 5.1% |
| Immigrants | Korea | 86.3 /100 | #126 | Excellent 5.1% |
Demographics Similar to Turks by Female Unemployment
In terms of female unemployment, the demographic groups most similar to Turks are New Zealander (5.0%, a difference of 0.12%), Filipino (5.0%, a difference of 0.14%), Immigrants from Netherlands (5.0%, a difference of 0.18%), Mongolian (5.0%, a difference of 0.19%), and Immigrants from Australia (5.0%, a difference of 0.19%).
| Demographics | Rating | Rank | Female Unemployment |
| Immigrants | Northern Europe | 98.0 /100 | #72 | Exceptional 4.9% |
| Russians | 98.0 /100 | #73 | Exceptional 5.0% |
| Immigrants | Bolivia | 98.0 /100 | #74 | Exceptional 5.0% |
| Immigrants | Singapore | 98.0 /100 | #75 | Exceptional 5.0% |
| Immigrants | Venezuela | 97.9 /100 | #76 | Exceptional 5.0% |
| Mongolians | 97.8 /100 | #77 | Exceptional 5.0% |
| Immigrants | Netherlands | 97.8 /100 | #78 | Exceptional 5.0% |
| Turks | 97.6 /100 | #79 | Exceptional 5.0% |
| New Zealanders | 97.4 /100 | #80 | Exceptional 5.0% |
| Filipinos | 97.3 /100 | #81 | Exceptional 5.0% |
| Immigrants | Australia | 97.3 /100 | #82 | Exceptional 5.0% |
| Immigrants | Serbia | 97.2 /100 | #83 | Exceptional 5.0% |
| Canadians | 97.2 /100 | #84 | Exceptional 5.0% |
| Ukrainians | 97.1 /100 | #85 | Exceptional 5.0% |
| Bolivians | 97.1 /100 | #86 | Exceptional 5.0% |