Immigrants from Nigeria vs Paraguayan Unemployment Among Seniors over 65 years
COMPARE
Immigrants from Nigeria
Paraguayan
Unemployment Among Seniors over 65 years
Unemployment Among Seniors over 65 years Comparison
Immigrants from Nigeria
Paraguayans
5.4%
UNEMPLOYMENT AMONG SENIORS OVER 65 YEARS
0.1/ 100
METRIC RATING
273rd/ 347
METRIC RANK
5.4%
UNEMPLOYMENT AMONG SENIORS OVER 65 YEARS
0.5/ 100
METRIC RATING
254th/ 347
METRIC RANK
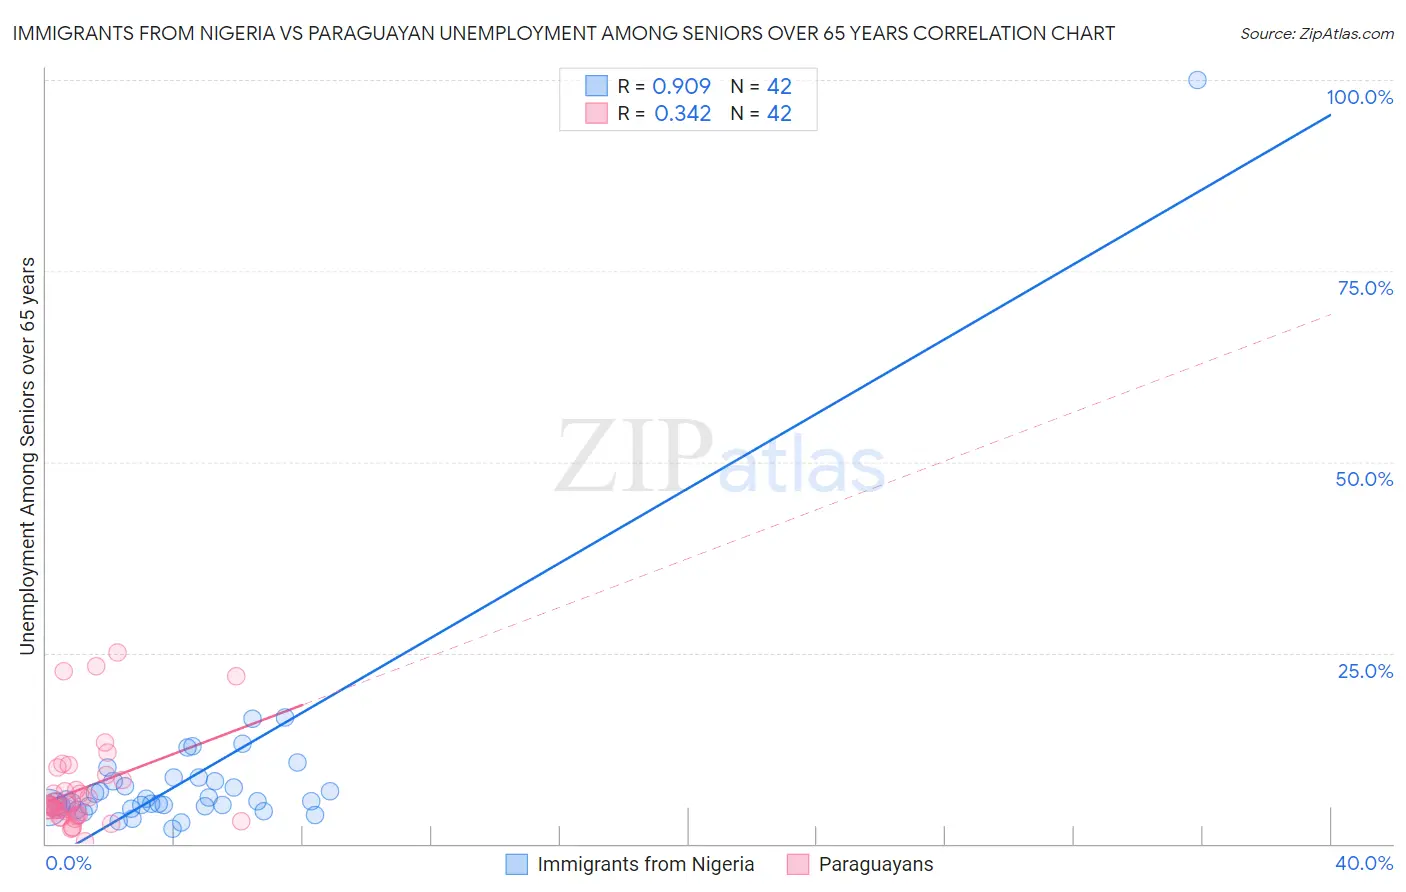
Immigrants from Nigeria vs Paraguayan Unemployment Among Seniors over 65 years Correlation Chart
The statistical analysis conducted on geographies consisting of 265,608,061 people shows a near-perfect positive correlation between the proportion of Immigrants from Nigeria and unemployment rate amomg seniors over the age of 65 in the United States with a correlation coefficient (R) of 0.909 and weighted average of 5.4%. Similarly, the statistical analysis conducted on geographies consisting of 92,590,465 people shows a mild positive correlation between the proportion of Paraguayans and unemployment rate amomg seniors over the age of 65 in the United States with a correlation coefficient (R) of 0.342 and weighted average of 5.4%, a difference of 1.2%.
Unemployment Among Seniors over 65 years Correlation Summary
| Measurement | Immigrants from Nigeria | Paraguayan |
| Minimum | 2.0% | 0.30% |
| Maximum | 100.0% | 25.0% |
| Range | 98.0% | 24.7% |
| Mean | 9.0% | 7.2% |
| Median | 5.5% | 5.0% |
| Interquartile 25% (IQ1) | 4.9% | 3.7% |
| Interquartile 75% (IQ3) | 8.2% | 8.3% |
| Interquartile Range (IQR) | 3.4% | 4.6% |
| Standard Deviation (Sample) | 14.8% | 5.9% |
| Standard Deviation (Population) | 14.6% | 5.9% |
Demographics Similar to Immigrants from Nigeria and Paraguayans by Unemployment Among Seniors over 65 years
In terms of unemployment among seniors over 65 years, the demographic groups most similar to Immigrants from Nigeria are Cypriot (5.4%, a difference of 0.010%), Immigrants from Jamaica (5.4%, a difference of 0.010%), Immigrants from Morocco (5.4%, a difference of 0.030%), Immigrants from Southern Europe (5.4%, a difference of 0.090%), and Hawaiian (5.4%, a difference of 0.23%). Similarly, the demographic groups most similar to Paraguayans are Immigrants from Peru (5.4%, a difference of 0.010%), Moroccan (5.4%, a difference of 0.030%), Immigrants from Sierra Leone (5.4%, a difference of 0.060%), Immigrants from Micronesia (5.4%, a difference of 0.12%), and Sierra Leonean (5.4%, a difference of 0.20%).
| Demographics | Rating | Rank | Unemployment Among Seniors over 65 years |
| Immigrants | Sierra Leone | 0.6 /100 | #253 | Tragic 5.4% |
| Paraguayans | 0.5 /100 | #254 | Tragic 5.4% |
| Immigrants | Peru | 0.5 /100 | #255 | Tragic 5.4% |
| Moroccans | 0.5 /100 | #256 | Tragic 5.4% |
| Immigrants | Micronesia | 0.4 /100 | #257 | Tragic 5.4% |
| Sierra Leoneans | 0.4 /100 | #258 | Tragic 5.4% |
| Immigrants | Ghana | 0.4 /100 | #259 | Tragic 5.4% |
| Native Hawaiians | 0.3 /100 | #260 | Tragic 5.4% |
| Spanish American Indians | 0.2 /100 | #261 | Tragic 5.4% |
| Immigrants | Grenada | 0.2 /100 | #262 | Tragic 5.4% |
| South Americans | 0.2 /100 | #263 | Tragic 5.4% |
| Central American Indians | 0.2 /100 | #264 | Tragic 5.4% |
| Immigrants | Colombia | 0.2 /100 | #265 | Tragic 5.4% |
| Pennsylvania Germans | 0.2 /100 | #266 | Tragic 5.4% |
| Chippewa | 0.2 /100 | #267 | Tragic 5.4% |
| Hawaiians | 0.1 /100 | #268 | Tragic 5.4% |
| Immigrants | Southern Europe | 0.1 /100 | #269 | Tragic 5.4% |
| Immigrants | Morocco | 0.1 /100 | #270 | Tragic 5.4% |
| Cypriots | 0.1 /100 | #271 | Tragic 5.4% |
| Immigrants | Jamaica | 0.1 /100 | #272 | Tragic 5.4% |
| Immigrants | Nigeria | 0.1 /100 | #273 | Tragic 5.4% |