Immigrants from Nigeria vs Immigrants from Jordan Unemployment Among Seniors over 65 years
COMPARE
Immigrants from Nigeria
Immigrants from Jordan
Unemployment Among Seniors over 65 years
Unemployment Among Seniors over 65 years Comparison
Immigrants from Nigeria
Immigrants from Jordan
5.4%
UNEMPLOYMENT AMONG SENIORS OVER 65 YEARS
0.1/ 100
METRIC RATING
273rd/ 347
METRIC RANK
4.9%
UNEMPLOYMENT AMONG SENIORS OVER 65 YEARS
99.9/ 100
METRIC RATING
46th/ 347
METRIC RANK
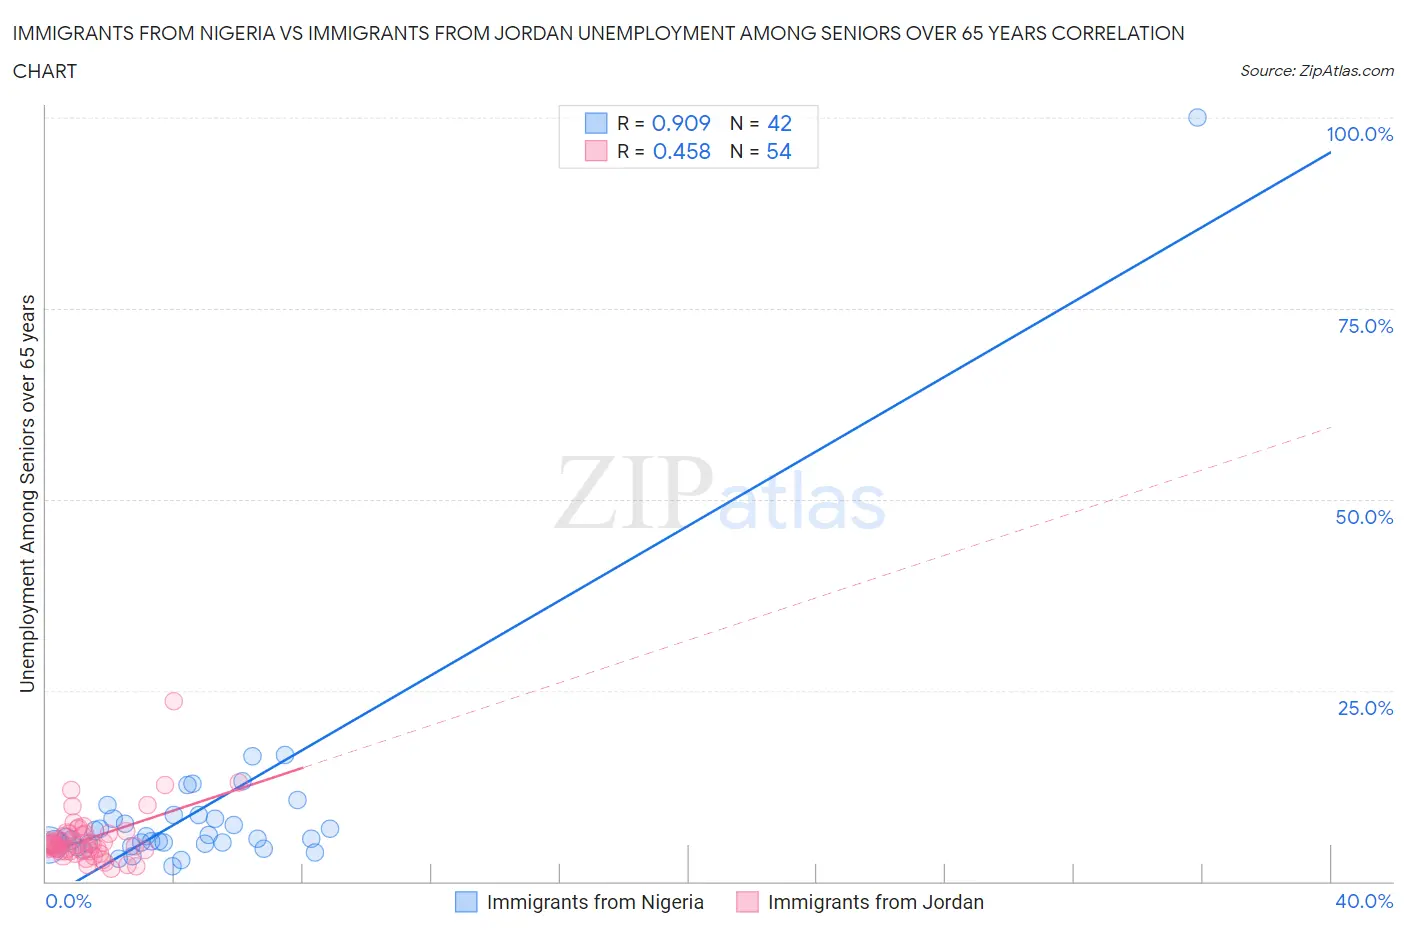
Immigrants from Nigeria vs Immigrants from Jordan Unemployment Among Seniors over 65 years Correlation Chart
The statistical analysis conducted on geographies consisting of 265,608,061 people shows a near-perfect positive correlation between the proportion of Immigrants from Nigeria and unemployment rate amomg seniors over the age of 65 in the United States with a correlation coefficient (R) of 0.909 and weighted average of 5.4%. Similarly, the statistical analysis conducted on geographies consisting of 173,797,777 people shows a moderate positive correlation between the proportion of Immigrants from Jordan and unemployment rate amomg seniors over the age of 65 in the United States with a correlation coefficient (R) of 0.458 and weighted average of 4.9%, a difference of 11.7%.
Unemployment Among Seniors over 65 years Correlation Summary
| Measurement | Immigrants from Nigeria | Immigrants from Jordan |
| Minimum | 2.0% | 1.7% |
| Maximum | 100.0% | 23.5% |
| Range | 98.0% | 21.8% |
| Mean | 9.0% | 5.6% |
| Median | 5.5% | 4.8% |
| Interquartile 25% (IQ1) | 4.9% | 4.0% |
| Interquartile 75% (IQ3) | 8.2% | 6.2% |
| Interquartile Range (IQR) | 3.4% | 2.2% |
| Standard Deviation (Sample) | 14.8% | 3.5% |
| Standard Deviation (Population) | 14.6% | 3.5% |
Similar Demographics by Unemployment Among Seniors over 65 years
Demographics Similar to Immigrants from Nigeria by Unemployment Among Seniors over 65 years
In terms of unemployment among seniors over 65 years, the demographic groups most similar to Immigrants from Nigeria are Cypriot (5.4%, a difference of 0.010%), Immigrants from Jamaica (5.4%, a difference of 0.010%), Immigrants from Morocco (5.4%, a difference of 0.030%), Immigrants from Brazil (5.4%, a difference of 0.040%), and Immigrants from Southern Europe (5.4%, a difference of 0.090%).
| Demographics | Rating | Rank | Unemployment Among Seniors over 65 years |
| Pennsylvania Germans | 0.2 /100 | #266 | Tragic 5.4% |
| Chippewa | 0.2 /100 | #267 | Tragic 5.4% |
| Hawaiians | 0.1 /100 | #268 | Tragic 5.4% |
| Immigrants | Southern Europe | 0.1 /100 | #269 | Tragic 5.4% |
| Immigrants | Morocco | 0.1 /100 | #270 | Tragic 5.4% |
| Cypriots | 0.1 /100 | #271 | Tragic 5.4% |
| Immigrants | Jamaica | 0.1 /100 | #272 | Tragic 5.4% |
| Immigrants | Nigeria | 0.1 /100 | #273 | Tragic 5.4% |
| Immigrants | Brazil | 0.1 /100 | #274 | Tragic 5.4% |
| Mexican American Indians | 0.1 /100 | #275 | Tragic 5.4% |
| Pueblo | 0.1 /100 | #276 | Tragic 5.4% |
| Immigrants | Western Africa | 0.1 /100 | #277 | Tragic 5.4% |
| Colville | 0.1 /100 | #278 | Tragic 5.4% |
| Brazilians | 0.1 /100 | #279 | Tragic 5.5% |
| Immigrants | South America | 0.1 /100 | #280 | Tragic 5.5% |
Demographics Similar to Immigrants from Jordan by Unemployment Among Seniors over 65 years
In terms of unemployment among seniors over 65 years, the demographic groups most similar to Immigrants from Jordan are German (4.9%, a difference of 0.030%), Choctaw (4.9%, a difference of 0.040%), Ethiopian (4.9%, a difference of 0.13%), Jordanian (4.9%, a difference of 0.17%), and Immigrants from Kenya (4.9%, a difference of 0.23%).
| Demographics | Rating | Rank | Unemployment Among Seniors over 65 years |
| Macedonians | 99.9 /100 | #39 | Exceptional 4.8% |
| Immigrants | Sweden | 99.9 /100 | #40 | Exceptional 4.8% |
| Kiowa | 99.9 /100 | #41 | Exceptional 4.8% |
| Swiss | 99.9 /100 | #42 | Exceptional 4.8% |
| Luxembourgers | 99.9 /100 | #43 | Exceptional 4.8% |
| Jordanians | 99.9 /100 | #44 | Exceptional 4.9% |
| Ethiopians | 99.9 /100 | #45 | Exceptional 4.9% |
| Immigrants | Jordan | 99.9 /100 | #46 | Exceptional 4.9% |
| Germans | 99.9 /100 | #47 | Exceptional 4.9% |
| Choctaw | 99.9 /100 | #48 | Exceptional 4.9% |
| Immigrants | Kenya | 99.9 /100 | #49 | Exceptional 4.9% |
| Immigrants | Austria | 99.9 /100 | #50 | Exceptional 4.9% |
| Scotch-Irish | 99.9 /100 | #51 | Exceptional 4.9% |
| Swedes | 99.9 /100 | #52 | Exceptional 4.9% |
| Immigrants | Sudan | 99.8 /100 | #53 | Exceptional 4.9% |