Apache vs Paraguayan Unemployment Among Seniors over 65 years
COMPARE
Apache
Paraguayan
Unemployment Among Seniors over 65 years
Unemployment Among Seniors over 65 years Comparison
Apache
Paraguayans
5.3%
UNEMPLOYMENT AMONG SENIORS OVER 65 YEARS
1.3/ 100
METRIC RATING
241st/ 347
METRIC RANK
5.4%
UNEMPLOYMENT AMONG SENIORS OVER 65 YEARS
0.5/ 100
METRIC RATING
254th/ 347
METRIC RANK
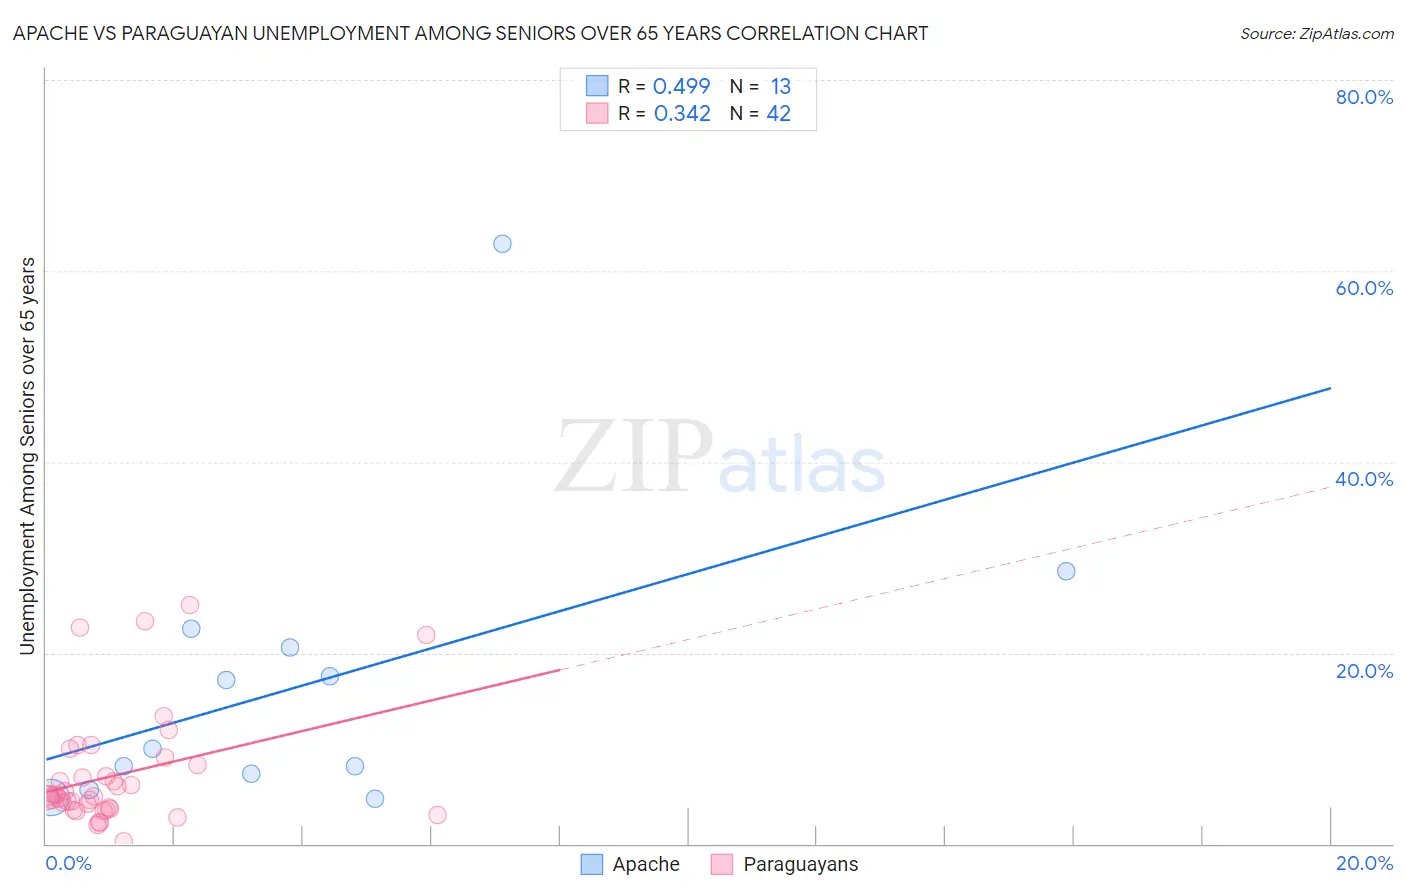
Apache vs Paraguayan Unemployment Among Seniors over 65 years Correlation Chart
The statistical analysis conducted on geographies consisting of 213,447,940 people shows a moderate positive correlation between the proportion of Apache and unemployment rate amomg seniors over the age of 65 in the United States with a correlation coefficient (R) of 0.499 and weighted average of 5.3%. Similarly, the statistical analysis conducted on geographies consisting of 92,590,465 people shows a mild positive correlation between the proportion of Paraguayans and unemployment rate amomg seniors over the age of 65 in the United States with a correlation coefficient (R) of 0.342 and weighted average of 5.4%, a difference of 0.71%.
Unemployment Among Seniors over 65 years Correlation Summary
| Measurement | Apache | Paraguayan |
| Minimum | 4.7% | 0.30% |
| Maximum | 62.8% | 25.0% |
| Range | 58.1% | 24.7% |
| Mean | 16.7% | 7.2% |
| Median | 9.9% | 5.0% |
| Interquartile 25% (IQ1) | 6.5% | 3.7% |
| Interquartile 75% (IQ3) | 21.5% | 8.3% |
| Interquartile Range (IQR) | 15.0% | 4.6% |
| Standard Deviation (Sample) | 15.8% | 5.9% |
| Standard Deviation (Population) | 15.2% | 5.9% |
Demographics Similar to Apache and Paraguayans by Unemployment Among Seniors over 65 years
In terms of unemployment among seniors over 65 years, the demographic groups most similar to Apache are Immigrants from Trinidad and Tobago (5.3%, a difference of 0.17%), Bahamian (5.3%, a difference of 0.26%), Immigrants from Senegal (5.3%, a difference of 0.28%), Nigerian (5.3%, a difference of 0.29%), and Immigrants from Israel (5.3%, a difference of 0.34%). Similarly, the demographic groups most similar to Paraguayans are Immigrants from Peru (5.4%, a difference of 0.010%), Moroccan (5.4%, a difference of 0.030%), Immigrants from Sierra Leone (5.4%, a difference of 0.060%), Trinidadian and Tobagonian (5.4%, a difference of 0.090%), and Immigrants from Micronesia (5.4%, a difference of 0.12%).
| Demographics | Rating | Rank | Unemployment Among Seniors over 65 years |
| Immigrants | Greece | 2.0 /100 | #237 | Tragic 5.3% |
| Immigrants | Israel | 2.0 /100 | #238 | Tragic 5.3% |
| Immigrants | Senegal | 1.8 /100 | #239 | Tragic 5.3% |
| Immigrants | Trinidad and Tobago | 1.6 /100 | #240 | Tragic 5.3% |
| Apache | 1.3 /100 | #241 | Tragic 5.3% |
| Bahamians | 0.9 /100 | #242 | Tragic 5.3% |
| Nigerians | 0.9 /100 | #243 | Tragic 5.3% |
| Peruvians | 0.8 /100 | #244 | Tragic 5.3% |
| Ottawa | 0.8 /100 | #245 | Tragic 5.3% |
| Colombians | 0.7 /100 | #246 | Tragic 5.3% |
| Immigrants | Caribbean | 0.7 /100 | #247 | Tragic 5.3% |
| French Canadians | 0.7 /100 | #248 | Tragic 5.4% |
| Immigrants | Immigrants | 0.6 /100 | #249 | Tragic 5.4% |
| Ghanaians | 0.6 /100 | #250 | Tragic 5.4% |
| West Indians | 0.6 /100 | #251 | Tragic 5.4% |
| Trinidadians and Tobagonians | 0.6 /100 | #252 | Tragic 5.4% |
| Immigrants | Sierra Leone | 0.6 /100 | #253 | Tragic 5.4% |
| Paraguayans | 0.5 /100 | #254 | Tragic 5.4% |
| Immigrants | Peru | 0.5 /100 | #255 | Tragic 5.4% |
| Moroccans | 0.5 /100 | #256 | Tragic 5.4% |
| Immigrants | Micronesia | 0.4 /100 | #257 | Tragic 5.4% |