Sioux vs Paraguayan Unemployment Among Seniors over 65 years
COMPARE
Sioux
Paraguayan
Unemployment Among Seniors over 65 years
Unemployment Among Seniors over 65 years Comparison
Sioux
Paraguayans
5.2%
UNEMPLOYMENT AMONG SENIORS OVER 65 YEARS
30.8/ 100
METRIC RATING
192nd/ 347
METRIC RANK
5.4%
UNEMPLOYMENT AMONG SENIORS OVER 65 YEARS
0.5/ 100
METRIC RATING
254th/ 347
METRIC RANK
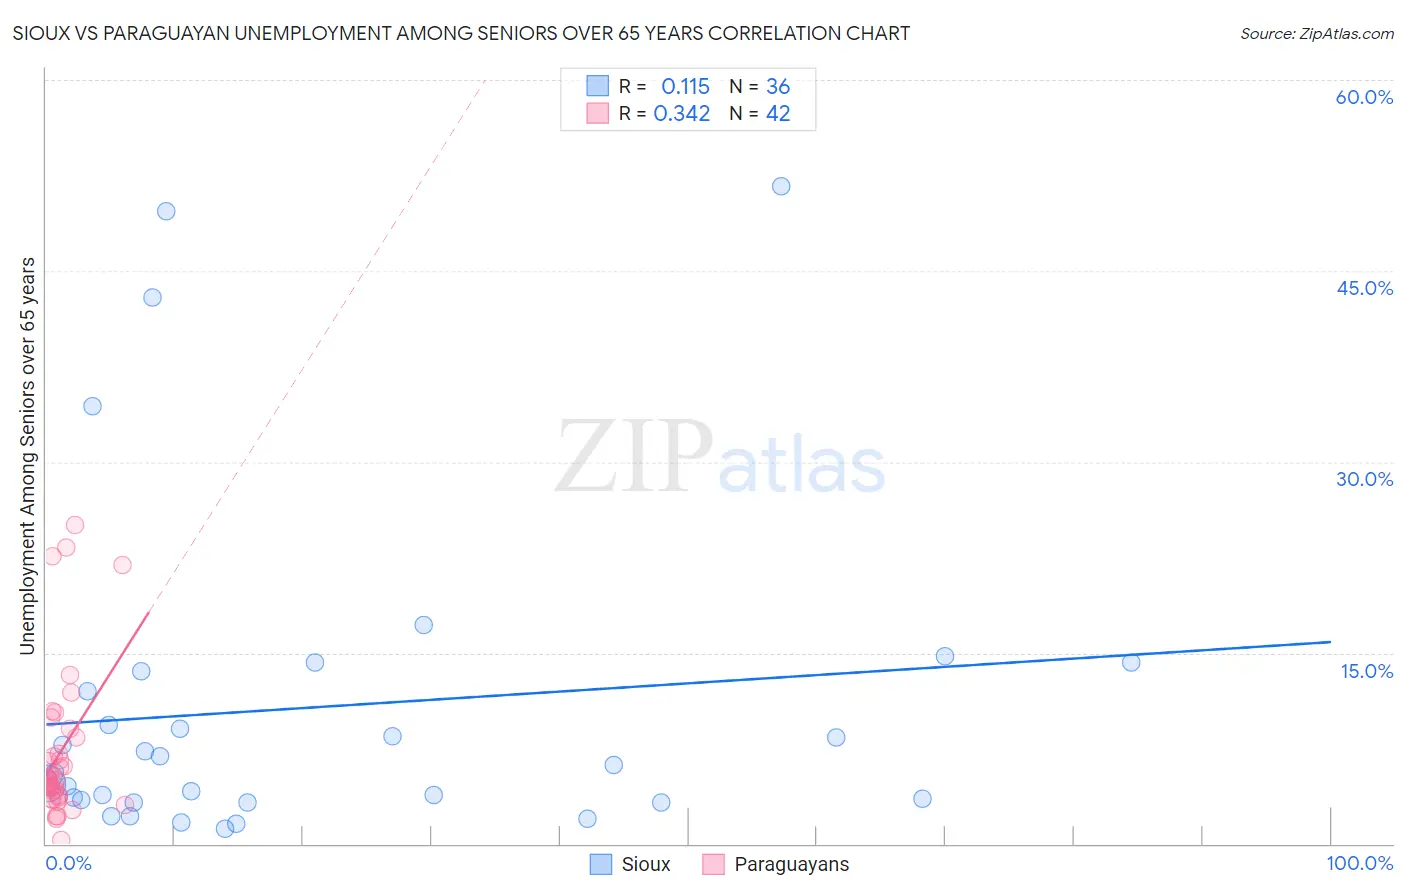
Sioux vs Paraguayan Unemployment Among Seniors over 65 years Correlation Chart
The statistical analysis conducted on geographies consisting of 211,727,022 people shows a poor positive correlation between the proportion of Sioux and unemployment rate amomg seniors over the age of 65 in the United States with a correlation coefficient (R) of 0.115 and weighted average of 5.2%. Similarly, the statistical analysis conducted on geographies consisting of 92,590,465 people shows a mild positive correlation between the proportion of Paraguayans and unemployment rate amomg seniors over the age of 65 in the United States with a correlation coefficient (R) of 0.342 and weighted average of 5.4%, a difference of 3.5%.
Unemployment Among Seniors over 65 years Correlation Summary
| Measurement | Sioux | Paraguayan |
| Minimum | 1.2% | 0.30% |
| Maximum | 51.7% | 25.0% |
| Range | 50.5% | 24.7% |
| Mean | 10.7% | 7.2% |
| Median | 5.9% | 5.0% |
| Interquartile 25% (IQ1) | 3.3% | 3.7% |
| Interquartile 75% (IQ3) | 12.8% | 8.3% |
| Interquartile Range (IQR) | 9.5% | 4.6% |
| Standard Deviation (Sample) | 13.1% | 5.9% |
| Standard Deviation (Population) | 12.9% | 5.9% |
Similar Demographics by Unemployment Among Seniors over 65 years
Demographics Similar to Sioux by Unemployment Among Seniors over 65 years
In terms of unemployment among seniors over 65 years, the demographic groups most similar to Sioux are Immigrants from Denmark (5.2%, a difference of 0.010%), Korean (5.2%, a difference of 0.030%), Bangladeshi (5.2%, a difference of 0.050%), Immigrants from Africa (5.2%, a difference of 0.050%), and Argentinean (5.2%, a difference of 0.070%).
| Demographics | Rating | Rank | Unemployment Among Seniors over 65 years |
| Immigrants | Iran | 36.0 /100 | #185 | Fair 5.2% |
| Americans | 35.1 /100 | #186 | Fair 5.2% |
| Somalis | 33.5 /100 | #187 | Fair 5.2% |
| Immigrants | Egypt | 33.2 /100 | #188 | Fair 5.2% |
| Bangladeshis | 32.3 /100 | #189 | Fair 5.2% |
| Koreans | 31.6 /100 | #190 | Fair 5.2% |
| Immigrants | Denmark | 31.0 /100 | #191 | Fair 5.2% |
| Sioux | 30.8 /100 | #192 | Fair 5.2% |
| Immigrants | Africa | 29.6 /100 | #193 | Fair 5.2% |
| Argentineans | 29.1 /100 | #194 | Fair 5.2% |
| Costa Ricans | 27.0 /100 | #195 | Fair 5.2% |
| Immigrants | Poland | 24.3 /100 | #196 | Fair 5.2% |
| Guamanians/Chamorros | 22.5 /100 | #197 | Fair 5.2% |
| Maltese | 19.6 /100 | #198 | Poor 5.2% |
| Immigrants | Europe | 19.0 /100 | #199 | Poor 5.2% |
Demographics Similar to Paraguayans by Unemployment Among Seniors over 65 years
In terms of unemployment among seniors over 65 years, the demographic groups most similar to Paraguayans are Immigrants from Peru (5.4%, a difference of 0.010%), Moroccan (5.4%, a difference of 0.030%), Immigrants from Sierra Leone (5.4%, a difference of 0.060%), Trinidadian and Tobagonian (5.4%, a difference of 0.090%), and Immigrants from Micronesia (5.4%, a difference of 0.12%).
| Demographics | Rating | Rank | Unemployment Among Seniors over 65 years |
| Immigrants | Caribbean | 0.7 /100 | #247 | Tragic 5.3% |
| French Canadians | 0.7 /100 | #248 | Tragic 5.4% |
| Immigrants | Immigrants | 0.6 /100 | #249 | Tragic 5.4% |
| Ghanaians | 0.6 /100 | #250 | Tragic 5.4% |
| West Indians | 0.6 /100 | #251 | Tragic 5.4% |
| Trinidadians and Tobagonians | 0.6 /100 | #252 | Tragic 5.4% |
| Immigrants | Sierra Leone | 0.6 /100 | #253 | Tragic 5.4% |
| Paraguayans | 0.5 /100 | #254 | Tragic 5.4% |
| Immigrants | Peru | 0.5 /100 | #255 | Tragic 5.4% |
| Moroccans | 0.5 /100 | #256 | Tragic 5.4% |
| Immigrants | Micronesia | 0.4 /100 | #257 | Tragic 5.4% |
| Sierra Leoneans | 0.4 /100 | #258 | Tragic 5.4% |
| Immigrants | Ghana | 0.4 /100 | #259 | Tragic 5.4% |
| Native Hawaiians | 0.3 /100 | #260 | Tragic 5.4% |
| Spanish American Indians | 0.2 /100 | #261 | Tragic 5.4% |