Immigrants from Nigeria vs Immigrants from Jordan Female Poverty Among 25-34 Year Olds
COMPARE
Immigrants from Nigeria
Immigrants from Jordan
Female Poverty Among 25-34 Year Olds
Female Poverty Among 25-34 Year Olds Comparison
Immigrants from Nigeria
Immigrants from Jordan
14.3%
FEMALE POVERTY AMONG 25-34 YEAR OLDS
6.2/ 100
METRIC RATING
215th/ 347
METRIC RANK
12.4%
FEMALE POVERTY AMONG 25-34 YEAR OLDS
98.5/ 100
METRIC RATING
79th/ 347
METRIC RANK
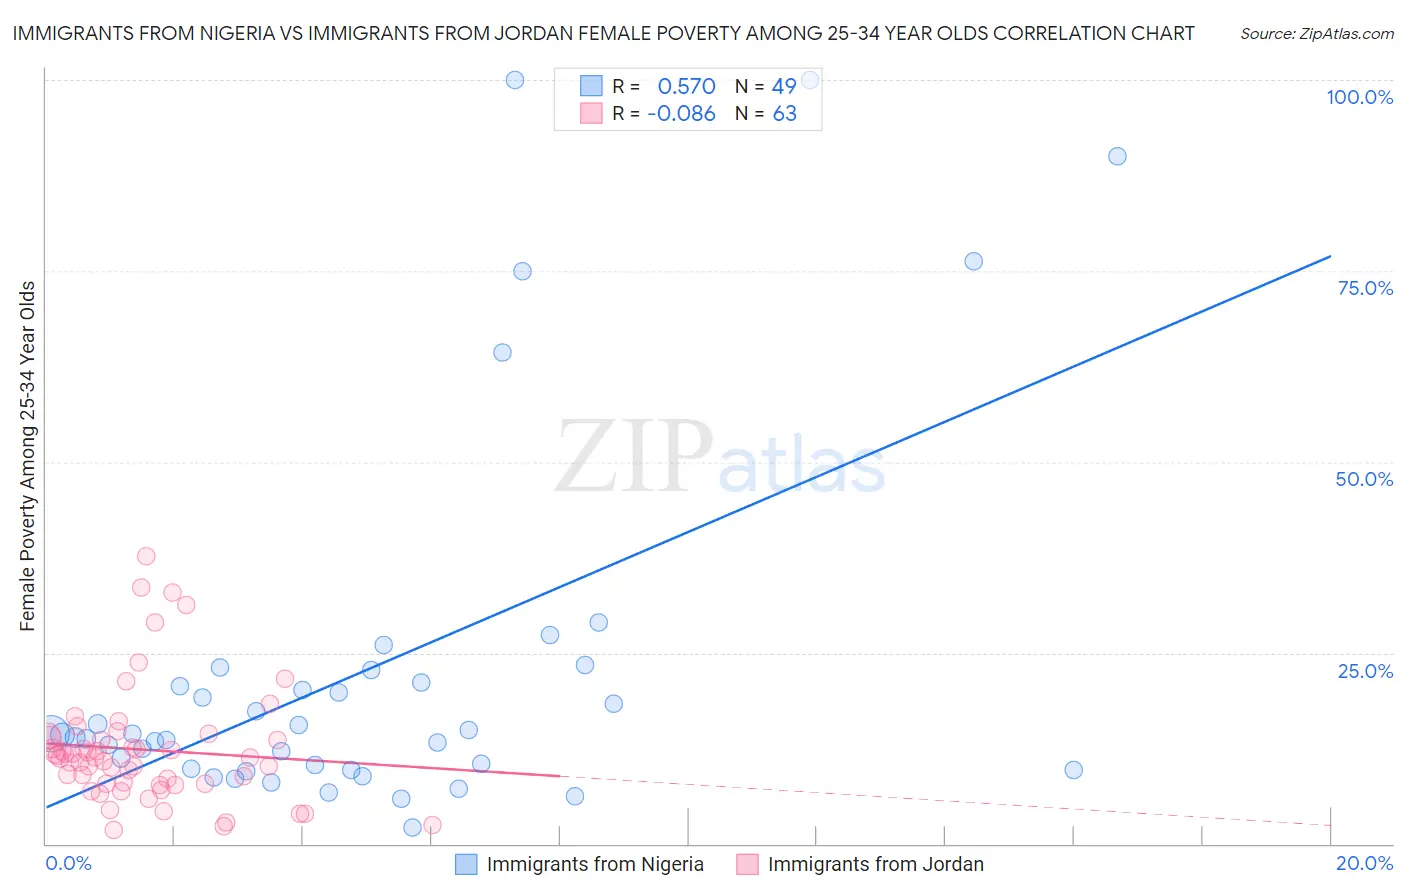
Immigrants from Nigeria vs Immigrants from Jordan Female Poverty Among 25-34 Year Olds Correlation Chart
The statistical analysis conducted on geographies consisting of 281,135,990 people shows a substantial positive correlation between the proportion of Immigrants from Nigeria and poverty level among females between the ages 25 and 34 in the United States with a correlation coefficient (R) of 0.570 and weighted average of 14.3%. Similarly, the statistical analysis conducted on geographies consisting of 180,469,872 people shows a slight negative correlation between the proportion of Immigrants from Jordan and poverty level among females between the ages 25 and 34 in the United States with a correlation coefficient (R) of -0.086 and weighted average of 12.4%, a difference of 15.7%.
Female Poverty Among 25-34 Year Olds Correlation Summary
| Measurement | Immigrants from Nigeria | Immigrants from Jordan |
| Minimum | 2.2% | 1.8% |
| Maximum | 100.0% | 37.6% |
| Range | 97.8% | 35.8% |
| Mean | 22.9% | 12.3% |
| Median | 14.2% | 11.3% |
| Interquartile 25% (IQ1) | 9.7% | 7.8% |
| Interquartile 75% (IQ3) | 22.0% | 13.9% |
| Interquartile Range (IQR) | 12.3% | 6.1% |
| Standard Deviation (Sample) | 24.4% | 7.6% |
| Standard Deviation (Population) | 24.1% | 7.5% |
Similar Demographics by Female Poverty Among 25-34 Year Olds
Demographics Similar to Immigrants from Nigeria by Female Poverty Among 25-34 Year Olds
In terms of female poverty among 25-34 year olds, the demographic groups most similar to Immigrants from Nigeria are French (14.3%, a difference of 0.020%), Puget Sound Salish (14.3%, a difference of 0.12%), Immigrants from Guyana (14.3%, a difference of 0.15%), French Canadian (14.3%, a difference of 0.25%), and Spanish American Indian (14.3%, a difference of 0.25%).
| Demographics | Rating | Rank | Female Poverty Among 25-34 Year Olds |
| Immigrants | Panama | 11.6 /100 | #208 | Poor 14.1% |
| Guyanese | 8.6 /100 | #209 | Tragic 14.2% |
| Panamanians | 8.6 /100 | #210 | Tragic 14.2% |
| Trinidadians and Tobagonians | 8.2 /100 | #211 | Tragic 14.2% |
| Immigrants | Guyana | 6.6 /100 | #212 | Tragic 14.3% |
| Puget Sound Salish | 6.5 /100 | #213 | Tragic 14.3% |
| French | 6.2 /100 | #214 | Tragic 14.3% |
| Immigrants | Nigeria | 6.2 /100 | #215 | Tragic 14.3% |
| French Canadians | 5.5 /100 | #216 | Tragic 14.3% |
| Spanish American Indians | 5.5 /100 | #217 | Tragic 14.3% |
| Immigrants | Thailand | 5.2 /100 | #218 | Tragic 14.3% |
| Ecuadorians | 5.2 /100 | #219 | Tragic 14.3% |
| Ghanaians | 4.8 /100 | #220 | Tragic 14.4% |
| Sudanese | 4.4 /100 | #221 | Tragic 14.4% |
| Immigrants | Portugal | 4.3 /100 | #222 | Tragic 14.4% |
Demographics Similar to Immigrants from Jordan by Female Poverty Among 25-34 Year Olds
In terms of female poverty among 25-34 year olds, the demographic groups most similar to Immigrants from Jordan are Immigrants from Ukraine (12.3%, a difference of 0.27%), Immigrants from Malaysia (12.4%, a difference of 0.27%), Immigrants from Italy (12.3%, a difference of 0.50%), Immigrants from Kazakhstan (12.4%, a difference of 0.51%), and Ethiopian (12.4%, a difference of 0.59%).
| Demographics | Rating | Rank | Female Poverty Among 25-34 Year Olds |
| Lithuanians | 99.1 /100 | #72 | Exceptional 12.2% |
| Immigrants | Vietnam | 98.9 /100 | #73 | Exceptional 12.3% |
| Immigrants | Sweden | 98.9 /100 | #74 | Exceptional 12.3% |
| Estonians | 98.9 /100 | #75 | Exceptional 12.3% |
| Greeks | 98.9 /100 | #76 | Exceptional 12.3% |
| Immigrants | Italy | 98.8 /100 | #77 | Exceptional 12.3% |
| Immigrants | Ukraine | 98.6 /100 | #78 | Exceptional 12.3% |
| Immigrants | Jordan | 98.5 /100 | #79 | Exceptional 12.4% |
| Immigrants | Malaysia | 98.3 /100 | #80 | Exceptional 12.4% |
| Immigrants | Kazakhstan | 98.1 /100 | #81 | Exceptional 12.4% |
| Ethiopians | 98.0 /100 | #82 | Exceptional 12.4% |
| Albanians | 97.7 /100 | #83 | Exceptional 12.5% |
| Immigrants | Latvia | 97.7 /100 | #84 | Exceptional 12.5% |
| Immigrants | South Eastern Asia | 97.6 /100 | #85 | Exceptional 12.5% |
| Croatians | 97.5 /100 | #86 | Exceptional 12.5% |