Immigrants from Nigeria vs Immigrants from Jordan Births to Unmarried Women
COMPARE
Immigrants from Nigeria
Immigrants from Jordan
Births to Unmarried Women
Births to Unmarried Women Comparison
Immigrants from Nigeria
Immigrants from Jordan
35.4%
BIRTHS TO UNMARRIED WOMEN
0.7/ 100
METRIC RATING
247th/ 347
METRIC RANK
29.0%
BIRTHS TO UNMARRIED WOMEN
97.4/ 100
METRIC RATING
86th/ 347
METRIC RANK
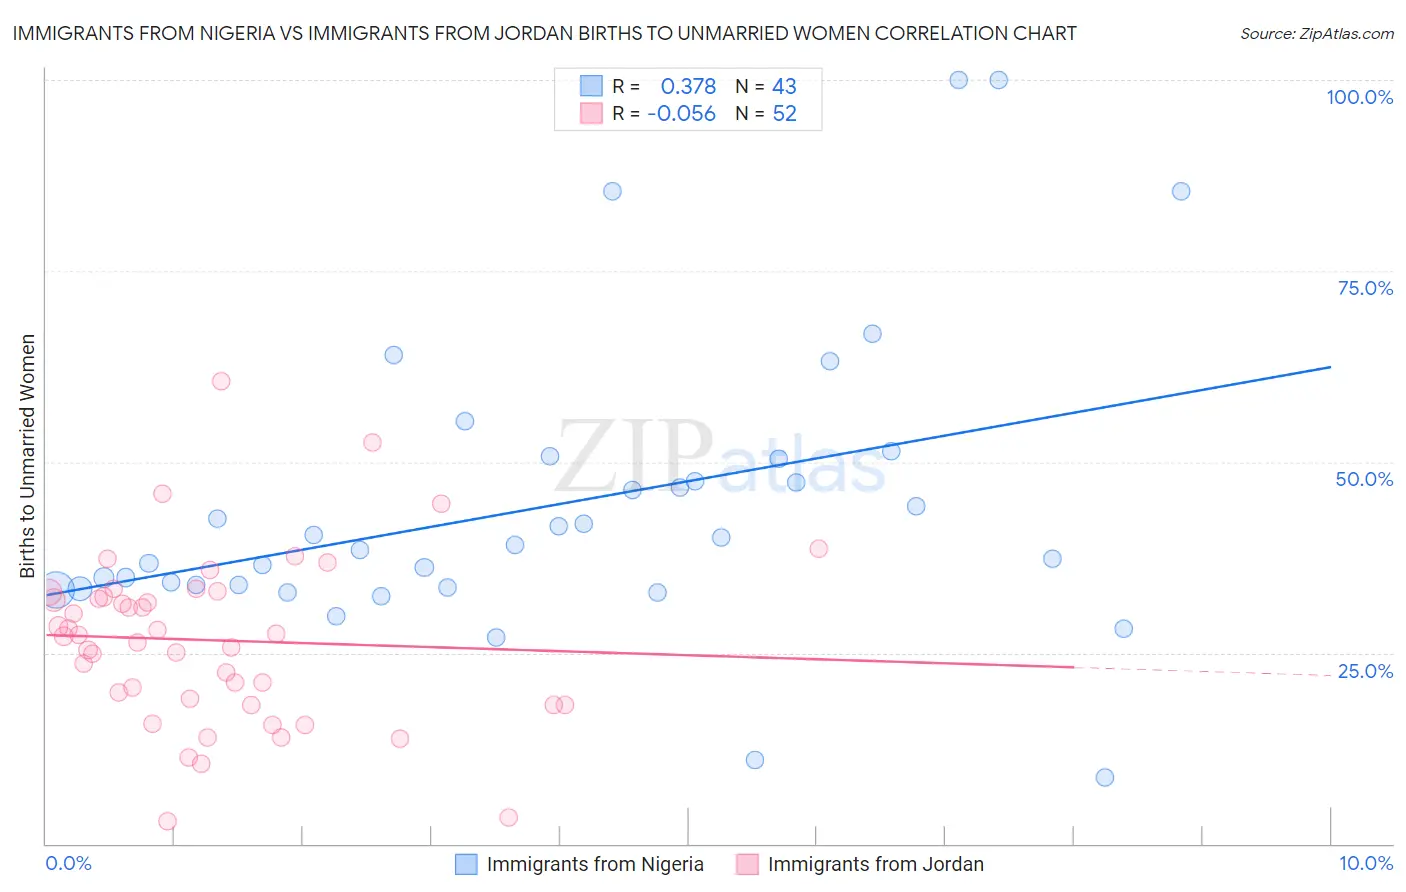
Immigrants from Nigeria vs Immigrants from Jordan Births to Unmarried Women Correlation Chart
The statistical analysis conducted on geographies consisting of 272,772,821 people shows a mild positive correlation between the proportion of Immigrants from Nigeria and percentage of births to unmarried women in the United States with a correlation coefficient (R) of 0.378 and weighted average of 35.4%. Similarly, the statistical analysis conducted on geographies consisting of 174,993,428 people shows a slight negative correlation between the proportion of Immigrants from Jordan and percentage of births to unmarried women in the United States with a correlation coefficient (R) of -0.056 and weighted average of 29.0%, a difference of 22.3%.
Births to Unmarried Women Correlation Summary
| Measurement | Immigrants from Nigeria | Immigrants from Jordan |
| Minimum | 8.7% | 2.9% |
| Maximum | 100.0% | 60.6% |
| Range | 91.3% | 57.7% |
| Mean | 44.4% | 26.6% |
| Median | 39.0% | 27.3% |
| Interquartile 25% (IQ1) | 33.6% | 18.5% |
| Interquartile 75% (IQ3) | 50.4% | 32.6% |
| Interquartile Range (IQR) | 16.8% | 14.1% |
| Standard Deviation (Sample) | 19.4% | 11.2% |
| Standard Deviation (Population) | 19.2% | 11.1% |
Similar Demographics by Births to Unmarried Women
Demographics Similar to Immigrants from Nigeria by Births to Unmarried Women
In terms of births to unmarried women, the demographic groups most similar to Immigrants from Nigeria are Nigerian (35.3%, a difference of 0.21%), Shoshone (35.3%, a difference of 0.32%), Nonimmigrants (35.5%, a difference of 0.33%), Bermudan (35.5%, a difference of 0.34%), and Guyanese (35.2%, a difference of 0.66%).
| Demographics | Rating | Rank | Births to Unmarried Women |
| Immigrants | Middle Africa | 1.2 /100 | #240 | Tragic 34.9% |
| Immigrants | Guyana | 1.2 /100 | #241 | Tragic 35.0% |
| Indonesians | 1.2 /100 | #242 | Tragic 35.0% |
| Japanese | 0.9 /100 | #243 | Tragic 35.2% |
| Guyanese | 0.9 /100 | #244 | Tragic 35.2% |
| Shoshone | 0.8 /100 | #245 | Tragic 35.3% |
| Nigerians | 0.7 /100 | #246 | Tragic 35.3% |
| Immigrants | Nigeria | 0.7 /100 | #247 | Tragic 35.4% |
| Immigrants | Nonimmigrants | 0.6 /100 | #248 | Tragic 35.5% |
| Bermudans | 0.6 /100 | #249 | Tragic 35.5% |
| Mexican American Indians | 0.4 /100 | #250 | Tragic 35.7% |
| Immigrants | Western Africa | 0.3 /100 | #251 | Tragic 36.0% |
| Salvadorans | 0.3 /100 | #252 | Tragic 36.0% |
| Immigrants | Portugal | 0.2 /100 | #253 | Tragic 36.2% |
| Potawatomi | 0.2 /100 | #254 | Tragic 36.2% |
Demographics Similar to Immigrants from Jordan by Births to Unmarried Women
In terms of births to unmarried women, the demographic groups most similar to Immigrants from Jordan are Sri Lankan (28.9%, a difference of 0.070%), Taiwanese (29.0%, a difference of 0.070%), Immigrants from France (29.0%, a difference of 0.080%), Immigrants from Poland (28.9%, a difference of 0.24%), and Immigrants from Saudi Arabia (29.1%, a difference of 0.36%).
| Demographics | Rating | Rank | Births to Unmarried Women |
| Danes | 98.2 /100 | #79 | Exceptional 28.7% |
| Immigrants | Afghanistan | 98.1 /100 | #80 | Exceptional 28.7% |
| Immigrants | Austria | 98.1 /100 | #81 | Exceptional 28.7% |
| Romanians | 98.0 /100 | #82 | Exceptional 28.7% |
| Immigrants | Kuwait | 98.0 /100 | #83 | Exceptional 28.8% |
| Immigrants | Poland | 97.6 /100 | #84 | Exceptional 28.9% |
| Sri Lankans | 97.5 /100 | #85 | Exceptional 28.9% |
| Immigrants | Jordan | 97.4 /100 | #86 | Exceptional 29.0% |
| Taiwanese | 97.3 /100 | #87 | Exceptional 29.0% |
| Immigrants | France | 97.3 /100 | #88 | Exceptional 29.0% |
| Immigrants | Saudi Arabia | 97.0 /100 | #89 | Exceptional 29.1% |
| Immigrants | Latvia | 96.8 /100 | #90 | Exceptional 29.1% |
| Immigrants | Fiji | 96.6 /100 | #91 | Exceptional 29.2% |
| Arabs | 96.5 /100 | #92 | Exceptional 29.2% |
| Estonians | 96.5 /100 | #93 | Exceptional 29.2% |