Immigrants from Netherlands vs Uruguayan Unemployment Among Ages 45 to 54 years
COMPARE
Immigrants from Netherlands
Uruguayan
Unemployment Among Ages 45 to 54 years
Unemployment Among Ages 45 to 54 years Comparison
Immigrants from Netherlands
Uruguayans
4.4%
UNEMPLOYMENT AMONG AGES 45 TO 54 YEARS
79.4/ 100
METRIC RATING
142nd/ 347
METRIC RANK
4.5%
UNEMPLOYMENT AMONG AGES 45 TO 54 YEARS
76.9/ 100
METRIC RATING
147th/ 347
METRIC RANK
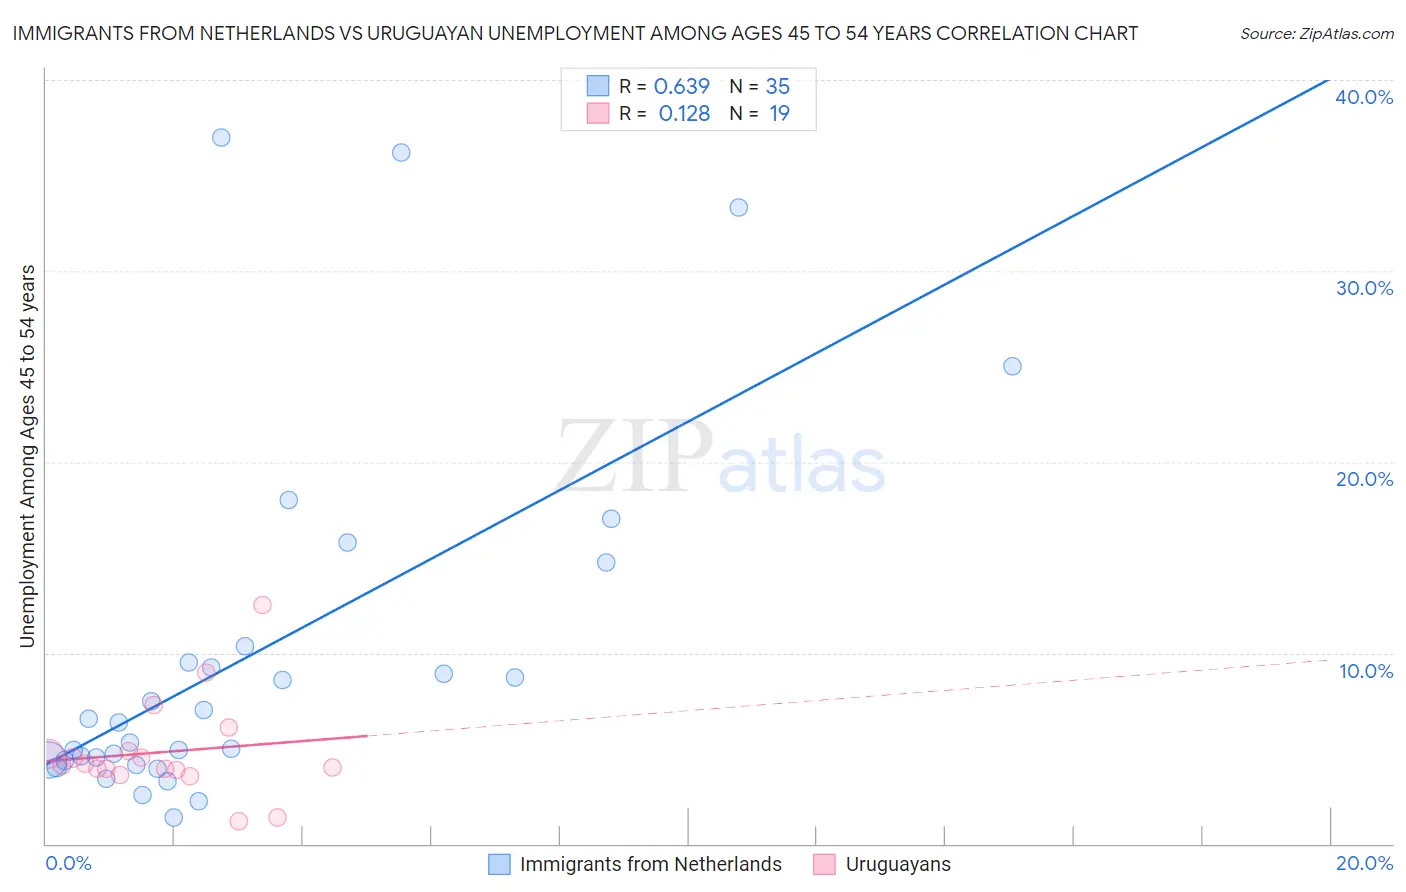
Immigrants from Netherlands vs Uruguayan Unemployment Among Ages 45 to 54 years Correlation Chart
The statistical analysis conducted on geographies consisting of 233,927,424 people shows a significant positive correlation between the proportion of Immigrants from Netherlands and unemployment rate among population between the ages 45 and 54 in the United States with a correlation coefficient (R) of 0.639 and weighted average of 4.4%. Similarly, the statistical analysis conducted on geographies consisting of 143,876,689 people shows a poor positive correlation between the proportion of Uruguayans and unemployment rate among population between the ages 45 and 54 in the United States with a correlation coefficient (R) of 0.128 and weighted average of 4.5%, a difference of 0.18%.
Unemployment Among Ages 45 to 54 years Correlation Summary
| Measurement | Immigrants from Netherlands | Uruguayan |
| Minimum | 1.4% | 1.2% |
| Maximum | 37.0% | 12.5% |
| Range | 35.6% | 11.3% |
| Mean | 9.9% | 4.8% |
| Median | 6.3% | 4.1% |
| Interquartile 25% (IQ1) | 4.4% | 3.9% |
| Interquartile 75% (IQ3) | 10.3% | 4.8% |
| Interquartile Range (IQR) | 6.0% | 0.97% |
| Standard Deviation (Sample) | 9.4% | 2.5% |
| Standard Deviation (Population) | 9.3% | 2.5% |
Demographics Similar to Immigrants from Netherlands and Uruguayans by Unemployment Among Ages 45 to 54 years
In terms of unemployment among ages 45 to 54 years, the demographic groups most similar to Immigrants from Netherlands are Immigrants from Afghanistan (4.4%, a difference of 0.020%), Macedonian (4.5%, a difference of 0.030%), Immigrants from Zaire (4.4%, a difference of 0.10%), Taiwanese (4.5%, a difference of 0.11%), and Immigrants from Latvia (4.5%, a difference of 0.14%). Similarly, the demographic groups most similar to Uruguayans are Syrian (4.5%, a difference of 0.030%), Immigrants from Latvia (4.5%, a difference of 0.040%), Taiwanese (4.5%, a difference of 0.070%), Immigrants from Austria (4.5%, a difference of 0.10%), and Costa Rican (4.5%, a difference of 0.10%).
| Demographics | Rating | Rank | Unemployment Among Ages 45 to 54 years |
| Afghans | 84.6 /100 | #134 | Excellent 4.4% |
| Immigrants | Eastern Asia | 84.0 /100 | #135 | Excellent 4.4% |
| Immigrants | Middle Africa | 83.3 /100 | #136 | Excellent 4.4% |
| Lebanese | 81.9 /100 | #137 | Excellent 4.4% |
| Immigrants | Congo | 81.8 /100 | #138 | Excellent 4.4% |
| Immigrants | Kuwait | 81.7 /100 | #139 | Excellent 4.4% |
| Immigrants | Zaire | 80.7 /100 | #140 | Excellent 4.4% |
| Immigrants | Afghanistan | 79.6 /100 | #141 | Good 4.4% |
| Immigrants | Netherlands | 79.4 /100 | #142 | Good 4.4% |
| Macedonians | 79.0 /100 | #143 | Good 4.5% |
| Taiwanese | 77.9 /100 | #144 | Good 4.5% |
| Immigrants | Latvia | 77.5 /100 | #145 | Good 4.5% |
| Syrians | 77.3 /100 | #146 | Good 4.5% |
| Uruguayans | 76.9 /100 | #147 | Good 4.5% |
| Immigrants | Austria | 75.3 /100 | #148 | Good 4.5% |
| Costa Ricans | 75.3 /100 | #149 | Good 4.5% |
| Tsimshian | 74.6 /100 | #150 | Good 4.5% |
| Cypriots | 74.4 /100 | #151 | Good 4.5% |
| Koreans | 73.1 /100 | #152 | Good 4.5% |
| Hungarians | 73.0 /100 | #153 | Good 4.5% |
| Immigrants | Spain | 72.5 /100 | #154 | Good 4.5% |