Northern European vs Macedonian Unemployment Among Youth under 25 years
COMPARE
Northern European
Macedonian
Unemployment Among Youth under 25 years
Unemployment Among Youth under 25 years Comparison
Northern Europeans
Macedonians
11.2%
UNEMPLOYMENT AMONG YOUTH UNDER 25 YEARS
96.2/ 100
METRIC RATING
82nd/ 347
METRIC RANK
11.2%
UNEMPLOYMENT AMONG YOUTH UNDER 25 YEARS
97.7/ 100
METRIC RATING
66th/ 347
METRIC RANK
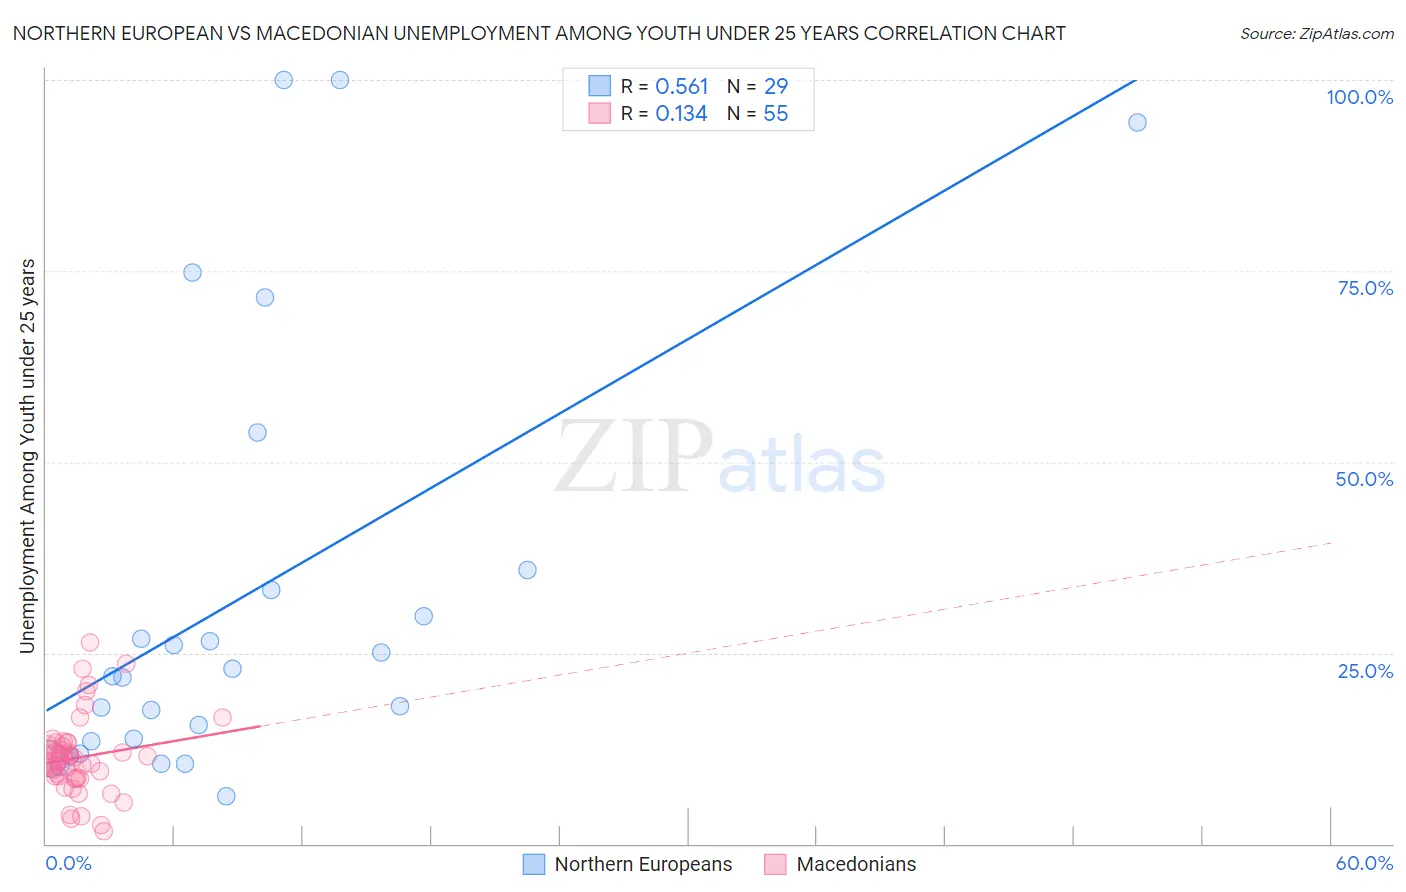
Northern European vs Macedonian Unemployment Among Youth under 25 years Correlation Chart
The statistical analysis conducted on geographies consisting of 398,834,682 people shows a substantial positive correlation between the proportion of Northern Europeans and unemployment rate among youth under the age of 25 in the United States with a correlation coefficient (R) of 0.561 and weighted average of 11.2%. Similarly, the statistical analysis conducted on geographies consisting of 132,001,261 people shows a poor positive correlation between the proportion of Macedonians and unemployment rate among youth under the age of 25 in the United States with a correlation coefficient (R) of 0.134 and weighted average of 11.2%, a difference of 0.55%.
Unemployment Among Youth under 25 years Correlation Summary
| Measurement | Northern European | Macedonian |
| Minimum | 6.3% | 1.6% |
| Maximum | 100.0% | 26.3% |
| Range | 93.7% | 24.7% |
| Mean | 32.1% | 11.3% |
| Median | 22.0% | 10.9% |
| Interquartile 25% (IQ1) | 12.6% | 8.8% |
| Interquartile 75% (IQ3) | 34.6% | 13.0% |
| Interquartile Range (IQR) | 22.0% | 4.2% |
| Standard Deviation (Sample) | 28.3% | 5.0% |
| Standard Deviation (Population) | 27.8% | 4.9% |
Demographics Similar to Northern Europeans and Macedonians by Unemployment Among Youth under 25 years
In terms of unemployment among youth under 25 years, the demographic groups most similar to Northern Europeans are Icelander (11.2%, a difference of 0.010%), Bolivian (11.2%, a difference of 0.050%), Immigrants from Bulgaria (11.2%, a difference of 0.060%), French Canadian (11.2%, a difference of 0.090%), and Immigrants from Canada (11.2%, a difference of 0.14%). Similarly, the demographic groups most similar to Macedonians are Chickasaw (11.2%, a difference of 0.020%), Immigrants from Singapore (11.2%, a difference of 0.030%), Immigrants from Kenya (11.2%, a difference of 0.040%), Immigrants from Moldova (11.2%, a difference of 0.080%), and Jordanian (11.1%, a difference of 0.090%).
| Demographics | Rating | Rank | Unemployment Among Youth under 25 years |
| Jordanians | 97.9 /100 | #64 | Exceptional 11.1% |
| Immigrants | Singapore | 97.8 /100 | #65 | Exceptional 11.2% |
| Macedonians | 97.7 /100 | #66 | Exceptional 11.2% |
| Chickasaw | 97.7 /100 | #67 | Exceptional 11.2% |
| Immigrants | Kenya | 97.6 /100 | #68 | Exceptional 11.2% |
| Immigrants | Moldova | 97.5 /100 | #69 | Exceptional 11.2% |
| Slavs | 97.5 /100 | #70 | Exceptional 11.2% |
| Bhutanese | 97.4 /100 | #71 | Exceptional 11.2% |
| Immigrants | Australia | 97.3 /100 | #72 | Exceptional 11.2% |
| Creek | 97.2 /100 | #73 | Exceptional 11.2% |
| New Zealanders | 97.2 /100 | #74 | Exceptional 11.2% |
| French | 97.1 /100 | #75 | Exceptional 11.2% |
| German Russians | 97.0 /100 | #76 | Exceptional 11.2% |
| Whites/Caucasians | 96.9 /100 | #77 | Exceptional 11.2% |
| Immigrants | Nicaragua | 96.7 /100 | #78 | Exceptional 11.2% |
| Immigrants | Canada | 96.7 /100 | #79 | Exceptional 11.2% |
| Immigrants | Bulgaria | 96.4 /100 | #80 | Exceptional 11.2% |
| Icelanders | 96.3 /100 | #81 | Exceptional 11.2% |
| Northern Europeans | 96.2 /100 | #82 | Exceptional 11.2% |
| Bolivians | 96.1 /100 | #83 | Exceptional 11.2% |
| French Canadians | 95.9 /100 | #84 | Exceptional 11.2% |