Immigrants from Morocco vs Vietnamese Unemployment Among Ages 25 to 29 years
COMPARE
Immigrants from Morocco
Vietnamese
Unemployment Among Ages 25 to 29 years
Unemployment Among Ages 25 to 29 years Comparison
Immigrants from Morocco
Vietnamese
6.1%
UNEMPLOYMENT AMONG AGES 25 TO 29 YEARS
99.5/ 100
METRIC RATING
34th/ 347
METRIC RANK
7.6%
UNEMPLOYMENT AMONG AGES 25 TO 29 YEARS
0.0/ 100
METRIC RATING
286th/ 347
METRIC RANK
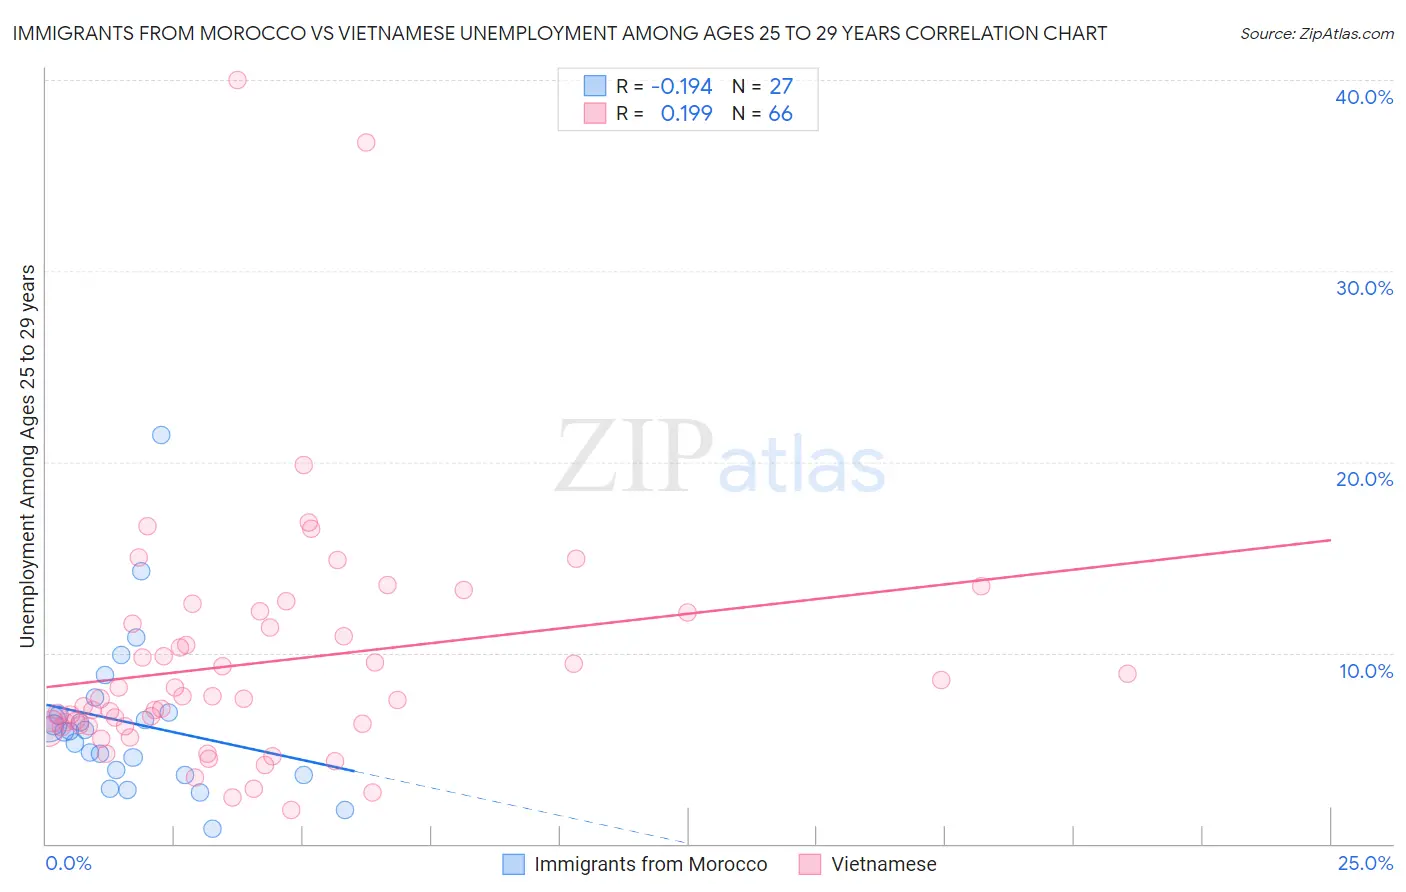
Immigrants from Morocco vs Vietnamese Unemployment Among Ages 25 to 29 years Correlation Chart
The statistical analysis conducted on geographies consisting of 175,989,414 people shows a poor negative correlation between the proportion of Immigrants from Morocco and unemployment rate among population between the ages 25 and 29 in the United States with a correlation coefficient (R) of -0.194 and weighted average of 6.1%. Similarly, the statistical analysis conducted on geographies consisting of 168,062,386 people shows a poor positive correlation between the proportion of Vietnamese and unemployment rate among population between the ages 25 and 29 in the United States with a correlation coefficient (R) of 0.199 and weighted average of 7.6%, a difference of 24.2%.
Unemployment Among Ages 25 to 29 years Correlation Summary
| Measurement | Immigrants from Morocco | Vietnamese |
| Minimum | 0.80% | 1.8% |
| Maximum | 21.4% | 40.0% |
| Range | 20.6% | 38.2% |
| Mean | 6.3% | 9.5% |
| Median | 5.9% | 7.6% |
| Interquartile 25% (IQ1) | 3.6% | 6.2% |
| Interquartile 75% (IQ3) | 6.9% | 11.5% |
| Interquartile Range (IQR) | 3.3% | 5.4% |
| Standard Deviation (Sample) | 4.2% | 6.5% |
| Standard Deviation (Population) | 4.1% | 6.4% |
Similar Demographics by Unemployment Among Ages 25 to 29 years
Demographics Similar to Immigrants from Morocco by Unemployment Among Ages 25 to 29 years
In terms of unemployment among ages 25 to 29 years, the demographic groups most similar to Immigrants from Morocco are Immigrants from Zimbabwe (6.1%, a difference of 0.040%), Taiwanese (6.1%, a difference of 0.060%), Immigrants from Serbia (6.1%, a difference of 0.12%), Ethiopian (6.1%, a difference of 0.25%), and Yugoslavian (6.1%, a difference of 0.26%).
| Demographics | Rating | Rank | Unemployment Among Ages 25 to 29 years |
| Immigrants | Zaire | 99.7 /100 | #27 | Exceptional 6.0% |
| Danes | 99.7 /100 | #28 | Exceptional 6.0% |
| Immigrants | South Central Asia | 99.7 /100 | #29 | Exceptional 6.1% |
| Bulgarians | 99.7 /100 | #30 | Exceptional 6.1% |
| Filipinos | 99.7 /100 | #31 | Exceptional 6.1% |
| Chinese | 99.6 /100 | #32 | Exceptional 6.1% |
| Yugoslavians | 99.6 /100 | #33 | Exceptional 6.1% |
| Immigrants | Morocco | 99.5 /100 | #34 | Exceptional 6.1% |
| Immigrants | Zimbabwe | 99.5 /100 | #35 | Exceptional 6.1% |
| Taiwanese | 99.5 /100 | #36 | Exceptional 6.1% |
| Immigrants | Serbia | 99.5 /100 | #37 | Exceptional 6.1% |
| Ethiopians | 99.4 /100 | #38 | Exceptional 6.1% |
| Indonesians | 99.3 /100 | #39 | Exceptional 6.1% |
| Immigrants | Kenya | 99.3 /100 | #40 | Exceptional 6.1% |
| Fijians | 99.3 /100 | #41 | Exceptional 6.1% |
Demographics Similar to Vietnamese by Unemployment Among Ages 25 to 29 years
In terms of unemployment among ages 25 to 29 years, the demographic groups most similar to Vietnamese are Senegalese (7.6%, a difference of 0.080%), Cherokee (7.6%, a difference of 0.21%), Creek (7.6%, a difference of 0.22%), Immigrants from Senegal (7.6%, a difference of 0.39%), and Immigrants from Bangladesh (7.5%, a difference of 0.56%).
| Demographics | Rating | Rank | Unemployment Among Ages 25 to 29 years |
| Nepalese | 0.0 /100 | #279 | Tragic 7.5% |
| Immigrants | Caribbean | 0.0 /100 | #280 | Tragic 7.5% |
| Immigrants | Bangladesh | 0.0 /100 | #281 | Tragic 7.5% |
| Immigrants | Senegal | 0.0 /100 | #282 | Tragic 7.6% |
| Creek | 0.0 /100 | #283 | Tragic 7.6% |
| Cherokee | 0.0 /100 | #284 | Tragic 7.6% |
| Senegalese | 0.0 /100 | #285 | Tragic 7.6% |
| Vietnamese | 0.0 /100 | #286 | Tragic 7.6% |
| Immigrants | Mexico | 0.0 /100 | #287 | Tragic 7.6% |
| Africans | 0.0 /100 | #288 | Tragic 7.6% |
| Belizeans | 0.0 /100 | #289 | Tragic 7.7% |
| Armenians | 0.0 /100 | #290 | Tragic 7.7% |
| Hispanics or Latinos | 0.0 /100 | #291 | Tragic 7.7% |
| Chippewa | 0.0 /100 | #292 | Tragic 7.8% |
| Immigrants | Belize | 0.0 /100 | #293 | Tragic 7.8% |