Immigrants from Morocco vs Thai Unemployment Among Ages 25 to 29 years
COMPARE
Immigrants from Morocco
Thai
Unemployment Among Ages 25 to 29 years
Unemployment Among Ages 25 to 29 years Comparison
Immigrants from Morocco
Thais
6.1%
UNEMPLOYMENT AMONG AGES 25 TO 29 YEARS
99.5/ 100
METRIC RATING
34th/ 347
METRIC RANK
5.9%
UNEMPLOYMENT AMONG AGES 25 TO 29 YEARS
99.9/ 100
METRIC RATING
19th/ 347
METRIC RANK
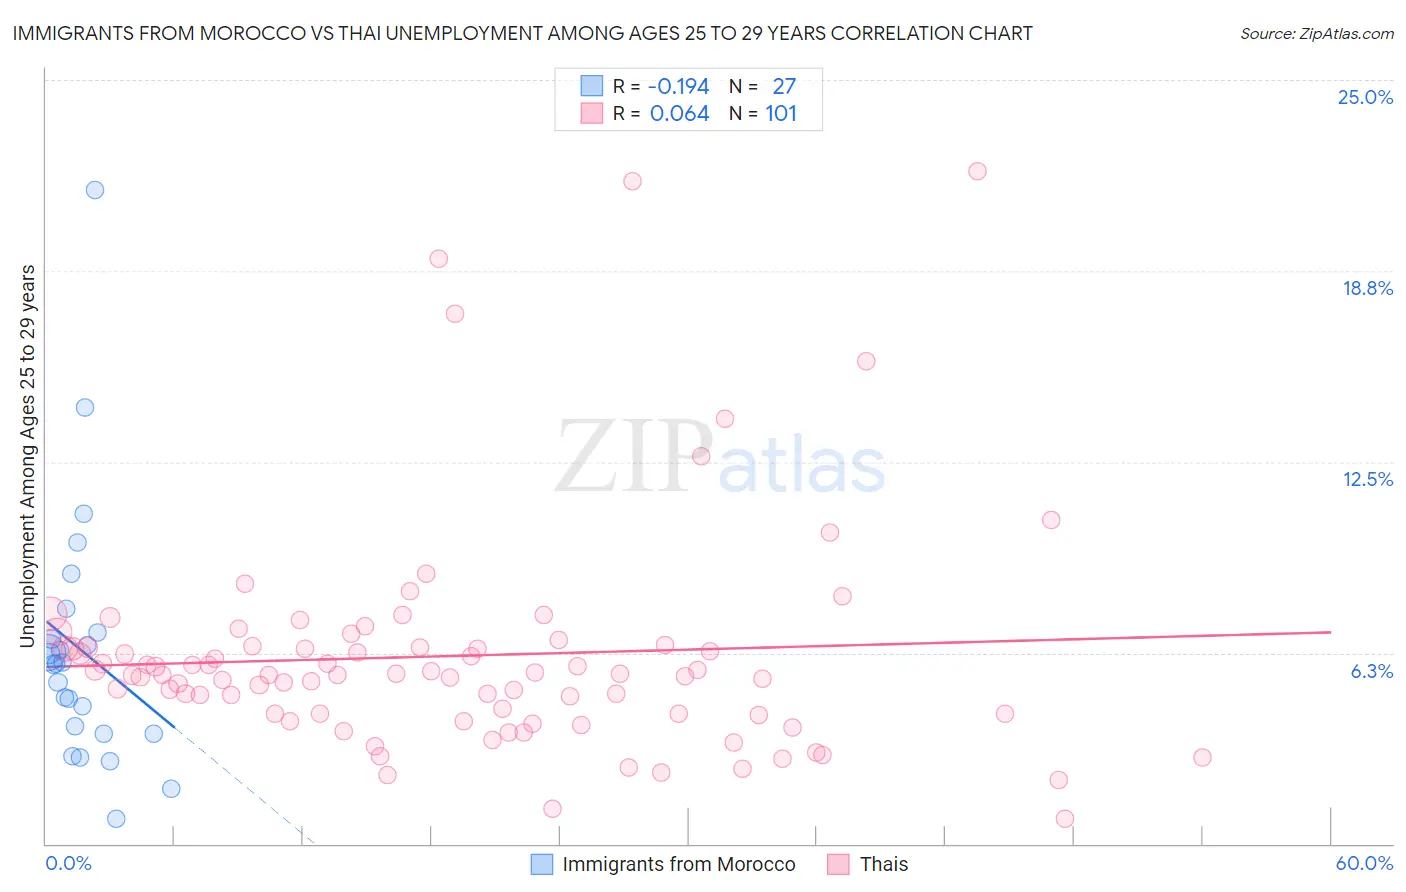
Immigrants from Morocco vs Thai Unemployment Among Ages 25 to 29 years Correlation Chart
The statistical analysis conducted on geographies consisting of 175,989,414 people shows a poor negative correlation between the proportion of Immigrants from Morocco and unemployment rate among population between the ages 25 and 29 in the United States with a correlation coefficient (R) of -0.194 and weighted average of 6.1%. Similarly, the statistical analysis conducted on geographies consisting of 447,521,485 people shows a slight positive correlation between the proportion of Thais and unemployment rate among population between the ages 25 and 29 in the United States with a correlation coefficient (R) of 0.064 and weighted average of 5.9%, a difference of 2.9%.
Unemployment Among Ages 25 to 29 years Correlation Summary
| Measurement | Immigrants from Morocco | Thai |
| Minimum | 0.80% | 0.80% |
| Maximum | 21.4% | 22.0% |
| Range | 20.6% | 21.2% |
| Mean | 6.3% | 6.2% |
| Median | 5.9% | 5.5% |
| Interquartile 25% (IQ1) | 3.6% | 4.3% |
| Interquartile 75% (IQ3) | 6.9% | 6.5% |
| Interquartile Range (IQR) | 3.3% | 2.2% |
| Standard Deviation (Sample) | 4.2% | 3.7% |
| Standard Deviation (Population) | 4.1% | 3.6% |
Demographics Similar to Immigrants from Morocco and Thais by Unemployment Among Ages 25 to 29 years
In terms of unemployment among ages 25 to 29 years, the demographic groups most similar to Immigrants from Morocco are Immigrants from Zimbabwe (6.1%, a difference of 0.040%), Taiwanese (6.1%, a difference of 0.060%), Yugoslavian (6.1%, a difference of 0.26%), Chinese (6.1%, a difference of 0.36%), and Filipino (6.1%, a difference of 0.71%). Similarly, the demographic groups most similar to Thais are Immigrants from Singapore (5.9%, a difference of 0.15%), Immigrants from Eritrea (5.9%, a difference of 0.18%), Bolivian (5.9%, a difference of 0.26%), Immigrants from Bulgaria (5.9%, a difference of 0.40%), and Immigrants from Ethiopia (6.0%, a difference of 0.53%).
| Demographics | Rating | Rank | Unemployment Among Ages 25 to 29 years |
| Immigrants | Bulgaria | 99.9 /100 | #16 | Exceptional 5.9% |
| Bolivians | 99.9 /100 | #17 | Exceptional 5.9% |
| Immigrants | Singapore | 99.9 /100 | #18 | Exceptional 5.9% |
| Thais | 99.9 /100 | #19 | Exceptional 5.9% |
| Immigrants | Eritrea | 99.9 /100 | #20 | Exceptional 5.9% |
| Immigrants | Ethiopia | 99.9 /100 | #21 | Exceptional 6.0% |
| Immigrants | Japan | 99.9 /100 | #22 | Exceptional 6.0% |
| Immigrants | Venezuela | 99.8 /100 | #23 | Exceptional 6.0% |
| Norwegians | 99.8 /100 | #24 | Exceptional 6.0% |
| New Zealanders | 99.8 /100 | #25 | Exceptional 6.0% |
| Immigrants | Eastern Africa | 99.8 /100 | #26 | Exceptional 6.0% |
| Immigrants | Zaire | 99.7 /100 | #27 | Exceptional 6.0% |
| Danes | 99.7 /100 | #28 | Exceptional 6.0% |
| Immigrants | South Central Asia | 99.7 /100 | #29 | Exceptional 6.1% |
| Bulgarians | 99.7 /100 | #30 | Exceptional 6.1% |
| Filipinos | 99.7 /100 | #31 | Exceptional 6.1% |
| Chinese | 99.6 /100 | #32 | Exceptional 6.1% |
| Yugoslavians | 99.6 /100 | #33 | Exceptional 6.1% |
| Immigrants | Morocco | 99.5 /100 | #34 | Exceptional 6.1% |
| Immigrants | Zimbabwe | 99.5 /100 | #35 | Exceptional 6.1% |
| Taiwanese | 99.5 /100 | #36 | Exceptional 6.1% |