Immigrants from Morocco vs Vietnamese Unemployment Among Ages 65 to 74 years
COMPARE
Immigrants from Morocco
Vietnamese
Unemployment Among Ages 65 to 74 years
Unemployment Among Ages 65 to 74 years Comparison
Immigrants from Morocco
Vietnamese
5.8%
UNEMPLOYMENT AMONG AGES 65 TO 74 YEARS
0.0/ 100
METRIC RATING
294th/ 347
METRIC RANK
5.9%
UNEMPLOYMENT AMONG AGES 65 TO 74 YEARS
0.0/ 100
METRIC RATING
313th/ 347
METRIC RANK
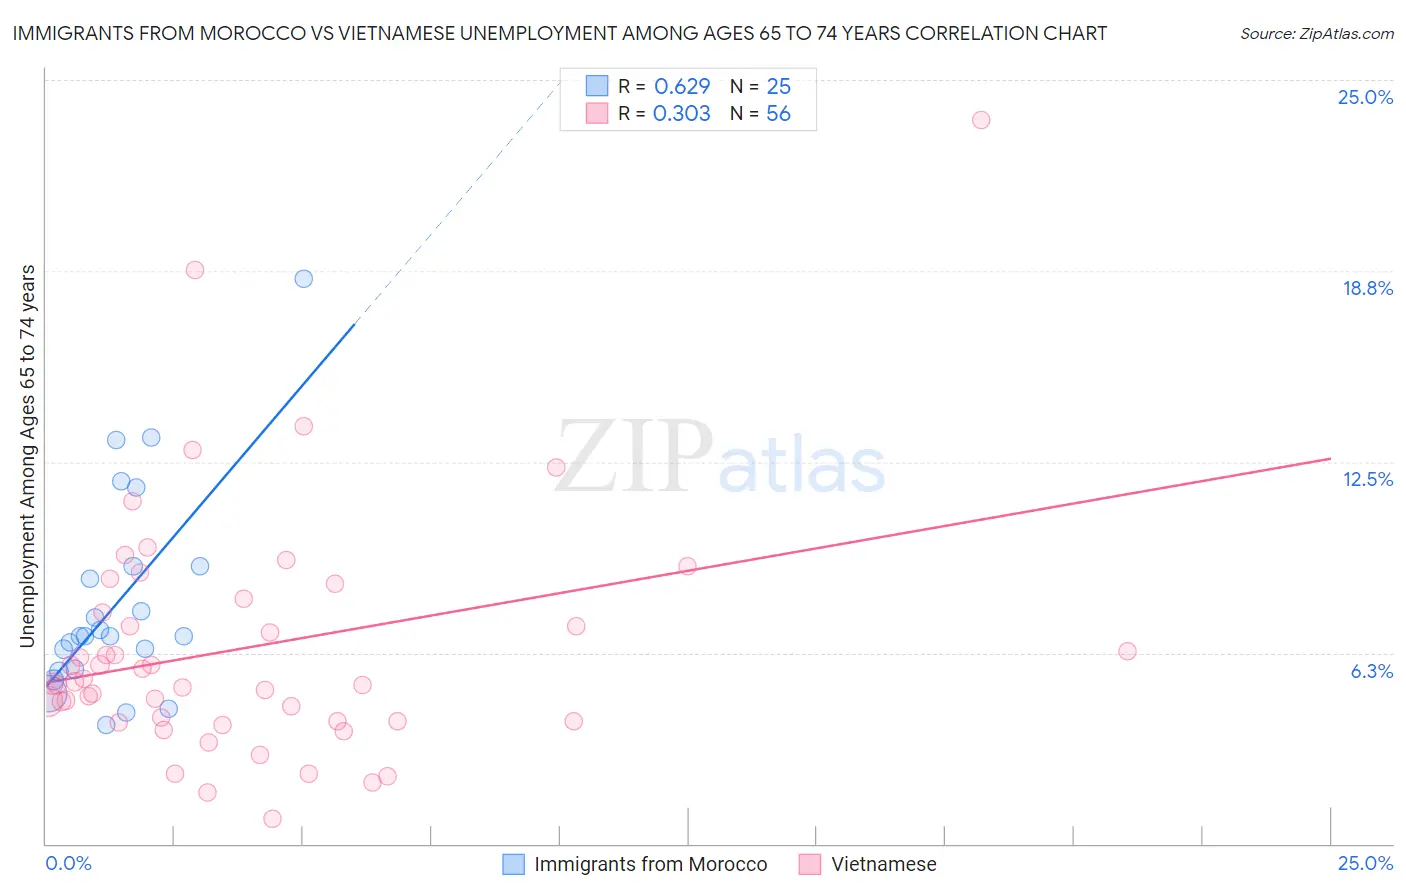
Immigrants from Morocco vs Vietnamese Unemployment Among Ages 65 to 74 years Correlation Chart
The statistical analysis conducted on geographies consisting of 169,573,409 people shows a significant positive correlation between the proportion of Immigrants from Morocco and unemployment rate among population between the ages 65 and 74 in the United States with a correlation coefficient (R) of 0.629 and weighted average of 5.8%. Similarly, the statistical analysis conducted on geographies consisting of 162,170,002 people shows a mild positive correlation between the proportion of Vietnamese and unemployment rate among population between the ages 65 and 74 in the United States with a correlation coefficient (R) of 0.303 and weighted average of 5.9%, a difference of 1.7%.
Unemployment Among Ages 65 to 74 years Correlation Summary
| Measurement | Immigrants from Morocco | Vietnamese |
| Minimum | 3.9% | 0.80% |
| Maximum | 18.5% | 23.7% |
| Range | 14.6% | 22.9% |
| Mean | 7.9% | 6.4% |
| Median | 6.8% | 5.3% |
| Interquartile 25% (IQ1) | 5.7% | 4.0% |
| Interquartile 75% (IQ3) | 9.1% | 7.8% |
| Interquartile Range (IQR) | 3.4% | 3.8% |
| Standard Deviation (Sample) | 3.4% | 4.0% |
| Standard Deviation (Population) | 3.4% | 4.0% |
Demographics Similar to Immigrants from Morocco and Vietnamese by Unemployment Among Ages 65 to 74 years
In terms of unemployment among ages 65 to 74 years, the demographic groups most similar to Immigrants from Morocco are Immigrants from Grenada (5.8%, a difference of 0.030%), Black/African American (5.8%, a difference of 0.030%), Pennsylvania German (5.8%, a difference of 0.49%), Houma (5.8%, a difference of 0.66%), and Immigrants from Latin America (5.8%, a difference of 0.85%). Similarly, the demographic groups most similar to Vietnamese are Hispanic or Latino (5.9%, a difference of 0.19%), Venezuelan (5.9%, a difference of 0.21%), Immigrants from Bangladesh (5.9%, a difference of 0.25%), Immigrants from Ecuador (5.8%, a difference of 0.39%), and Guatemalan (5.8%, a difference of 0.43%).
| Demographics | Rating | Rank | Unemployment Among Ages 65 to 74 years |
| Immigrants | Grenada | 0.0 /100 | #293 | Tragic 5.8% |
| Immigrants | Morocco | 0.0 /100 | #294 | Tragic 5.8% |
| Blacks/African Americans | 0.0 /100 | #295 | Tragic 5.8% |
| Pennsylvania Germans | 0.0 /100 | #296 | Tragic 5.8% |
| Houma | 0.0 /100 | #297 | Tragic 5.8% |
| Immigrants | Latin America | 0.0 /100 | #298 | Tragic 5.8% |
| Barbadians | 0.0 /100 | #299 | Tragic 5.8% |
| Ecuadorians | 0.0 /100 | #300 | Tragic 5.8% |
| Armenians | 0.0 /100 | #301 | Tragic 5.8% |
| Liberians | 0.0 /100 | #302 | Tragic 5.8% |
| Arapaho | 0.0 /100 | #303 | Tragic 5.8% |
| Salvadorans | 0.0 /100 | #304 | Tragic 5.8% |
| Mexicans | 0.0 /100 | #305 | Tragic 5.8% |
| Cheyenne | 0.0 /100 | #306 | Tragic 5.8% |
| British West Indians | 0.0 /100 | #307 | Tragic 5.8% |
| Guatemalans | 0.0 /100 | #308 | Tragic 5.8% |
| Immigrants | Ecuador | 0.0 /100 | #309 | Tragic 5.8% |
| Immigrants | Bangladesh | 0.0 /100 | #310 | Tragic 5.9% |
| Venezuelans | 0.0 /100 | #311 | Tragic 5.9% |
| Hispanics or Latinos | 0.0 /100 | #312 | Tragic 5.9% |
| Vietnamese | 0.0 /100 | #313 | Tragic 5.9% |