Immigrants from Morocco vs Yakama Unemployment Among Ages 25 to 29 years
COMPARE
Immigrants from Morocco
Yakama
Unemployment Among Ages 25 to 29 years
Unemployment Among Ages 25 to 29 years Comparison
Immigrants from Morocco
Yakama
6.1%
UNEMPLOYMENT AMONG AGES 25 TO 29 YEARS
99.5/ 100
METRIC RATING
34th/ 347
METRIC RANK
8.8%
UNEMPLOYMENT AMONG AGES 25 TO 29 YEARS
0.0/ 100
METRIC RATING
325th/ 347
METRIC RANK
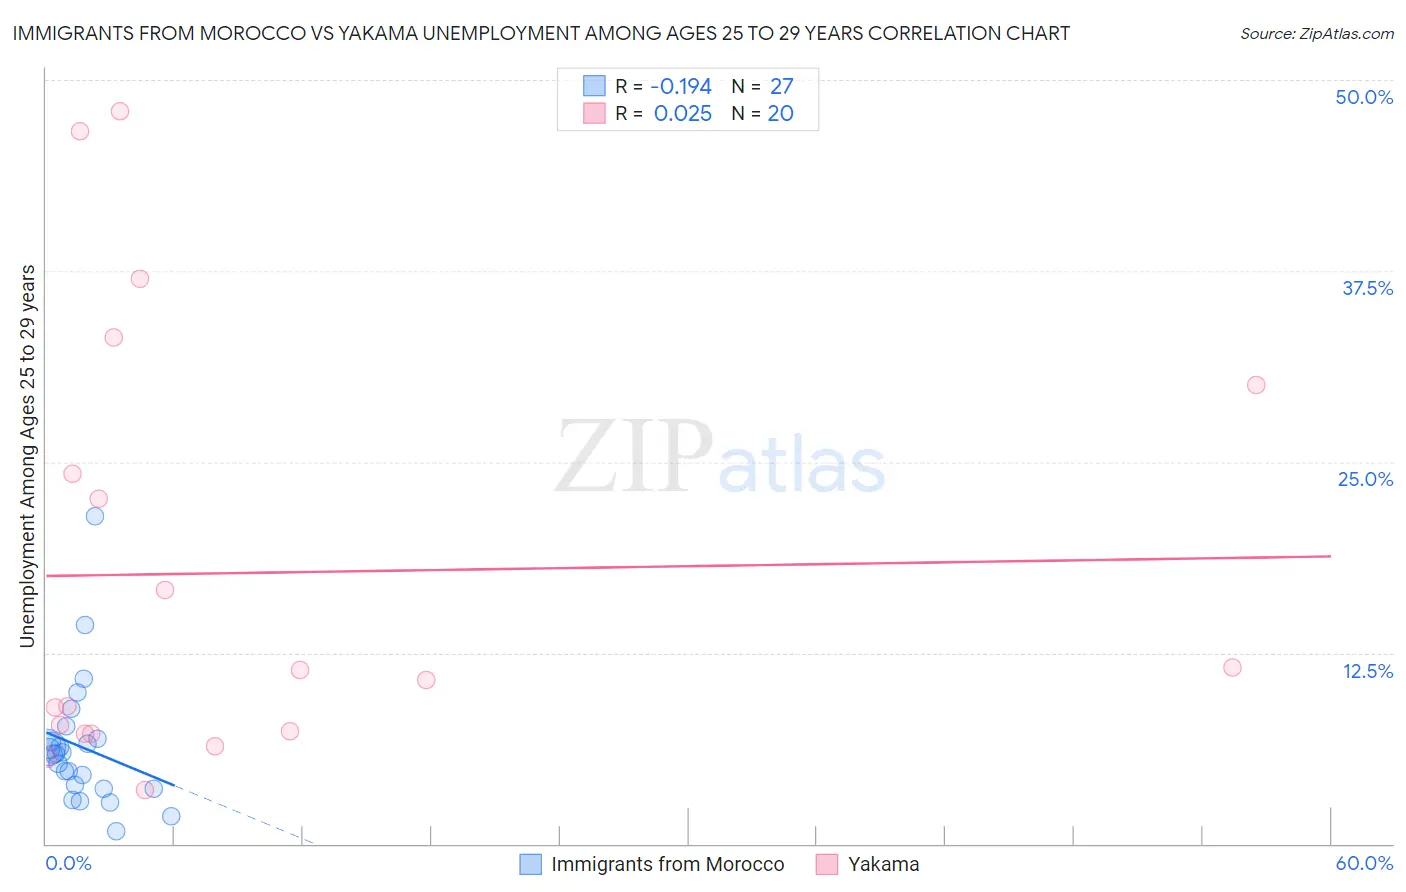
Immigrants from Morocco vs Yakama Unemployment Among Ages 25 to 29 years Correlation Chart
The statistical analysis conducted on geographies consisting of 175,989,414 people shows a poor negative correlation between the proportion of Immigrants from Morocco and unemployment rate among population between the ages 25 and 29 in the United States with a correlation coefficient (R) of -0.194 and weighted average of 6.1%. Similarly, the statistical analysis conducted on geographies consisting of 19,619,825 people shows no correlation between the proportion of Yakama and unemployment rate among population between the ages 25 and 29 in the United States with a correlation coefficient (R) of 0.025 and weighted average of 8.8%, a difference of 43.5%.
Unemployment Among Ages 25 to 29 years Correlation Summary
| Measurement | Immigrants from Morocco | Yakama |
| Minimum | 0.80% | 3.5% |
| Maximum | 21.4% | 47.9% |
| Range | 20.6% | 44.4% |
| Mean | 6.3% | 17.7% |
| Median | 5.9% | 11.1% |
| Interquartile 25% (IQ1) | 3.6% | 7.3% |
| Interquartile 75% (IQ3) | 6.9% | 27.1% |
| Interquartile Range (IQR) | 3.3% | 19.8% |
| Standard Deviation (Sample) | 4.2% | 14.1% |
| Standard Deviation (Population) | 4.1% | 13.7% |
Similar Demographics by Unemployment Among Ages 25 to 29 years
Demographics Similar to Immigrants from Morocco by Unemployment Among Ages 25 to 29 years
In terms of unemployment among ages 25 to 29 years, the demographic groups most similar to Immigrants from Morocco are Immigrants from Zimbabwe (6.1%, a difference of 0.040%), Taiwanese (6.1%, a difference of 0.060%), Immigrants from Serbia (6.1%, a difference of 0.12%), Ethiopian (6.1%, a difference of 0.25%), and Yugoslavian (6.1%, a difference of 0.26%).
| Demographics | Rating | Rank | Unemployment Among Ages 25 to 29 years |
| Immigrants | Zaire | 99.7 /100 | #27 | Exceptional 6.0% |
| Danes | 99.7 /100 | #28 | Exceptional 6.0% |
| Immigrants | South Central Asia | 99.7 /100 | #29 | Exceptional 6.1% |
| Bulgarians | 99.7 /100 | #30 | Exceptional 6.1% |
| Filipinos | 99.7 /100 | #31 | Exceptional 6.1% |
| Chinese | 99.6 /100 | #32 | Exceptional 6.1% |
| Yugoslavians | 99.6 /100 | #33 | Exceptional 6.1% |
| Immigrants | Morocco | 99.5 /100 | #34 | Exceptional 6.1% |
| Immigrants | Zimbabwe | 99.5 /100 | #35 | Exceptional 6.1% |
| Taiwanese | 99.5 /100 | #36 | Exceptional 6.1% |
| Immigrants | Serbia | 99.5 /100 | #37 | Exceptional 6.1% |
| Ethiopians | 99.4 /100 | #38 | Exceptional 6.1% |
| Indonesians | 99.3 /100 | #39 | Exceptional 6.1% |
| Immigrants | Kenya | 99.3 /100 | #40 | Exceptional 6.1% |
| Fijians | 99.3 /100 | #41 | Exceptional 6.1% |
Demographics Similar to Yakama by Unemployment Among Ages 25 to 29 years
In terms of unemployment among ages 25 to 29 years, the demographic groups most similar to Yakama are Houma (8.7%, a difference of 0.51%), Dominican (8.7%, a difference of 0.87%), Tlingit-Haida (8.7%, a difference of 0.96%), Immigrants from Dominican Republic (8.6%, a difference of 1.8%), and Black/African American (8.6%, a difference of 2.4%).
| Demographics | Rating | Rank | Unemployment Among Ages 25 to 29 years |
| Guyanese | 0.0 /100 | #318 | Tragic 8.5% |
| Immigrants | Armenia | 0.0 /100 | #319 | Tragic 8.5% |
| Blacks/African Americans | 0.0 /100 | #320 | Tragic 8.6% |
| Immigrants | Dominican Republic | 0.0 /100 | #321 | Tragic 8.6% |
| Tlingit-Haida | 0.0 /100 | #322 | Tragic 8.7% |
| Dominicans | 0.0 /100 | #323 | Tragic 8.7% |
| Houma | 0.0 /100 | #324 | Tragic 8.7% |
| Yakama | 0.0 /100 | #325 | Tragic 8.8% |
| Shoshone | 0.0 /100 | #326 | Tragic 9.2% |
| Colville | 0.0 /100 | #327 | Tragic 9.2% |
| Apache | 0.0 /100 | #328 | Tragic 9.5% |
| Aleuts | 0.0 /100 | #329 | Tragic 9.7% |
| Natives/Alaskans | 0.0 /100 | #330 | Tragic 9.8% |
| Alaska Natives | 0.0 /100 | #331 | Tragic 10.2% |
| Pueblo | 0.0 /100 | #332 | Tragic 10.4% |