Immigrants from Moldova vs Thai Unemployment Among Ages 25 to 29 years
COMPARE
Immigrants from Moldova
Thai
Unemployment Among Ages 25 to 29 years
Unemployment Among Ages 25 to 29 years Comparison
Immigrants from Moldova
Thais
6.5%
UNEMPLOYMENT AMONG AGES 25 TO 29 YEARS
84.5/ 100
METRIC RATING
120th/ 347
METRIC RANK
5.9%
UNEMPLOYMENT AMONG AGES 25 TO 29 YEARS
99.9/ 100
METRIC RATING
19th/ 347
METRIC RANK
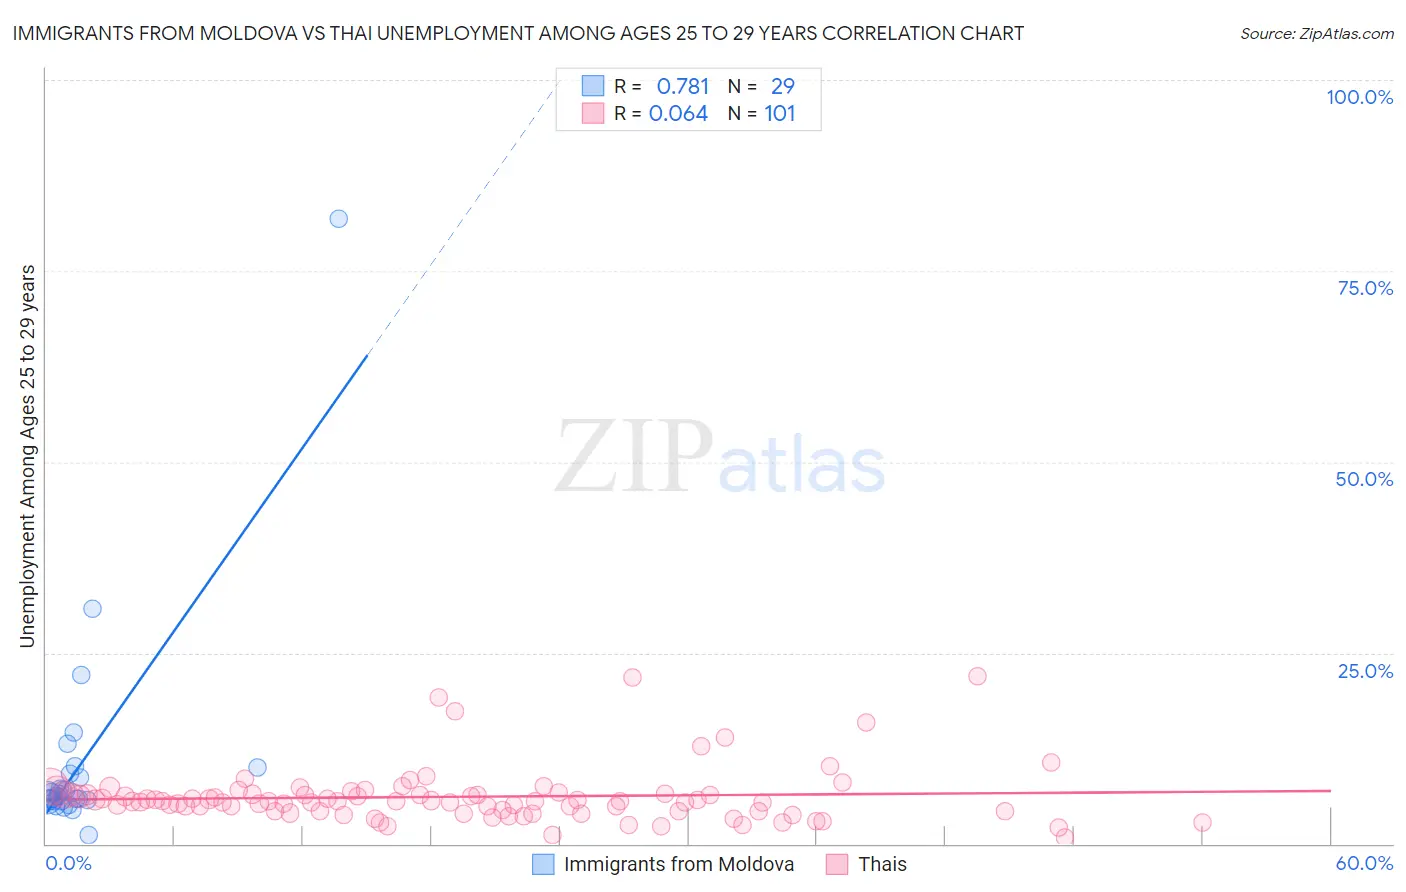
Immigrants from Moldova vs Thai Unemployment Among Ages 25 to 29 years Correlation Chart
The statistical analysis conducted on geographies consisting of 121,818,522 people shows a strong positive correlation between the proportion of Immigrants from Moldova and unemployment rate among population between the ages 25 and 29 in the United States with a correlation coefficient (R) of 0.781 and weighted average of 6.5%. Similarly, the statistical analysis conducted on geographies consisting of 447,521,485 people shows a slight positive correlation between the proportion of Thais and unemployment rate among population between the ages 25 and 29 in the United States with a correlation coefficient (R) of 0.064 and weighted average of 5.9%, a difference of 9.1%.
Unemployment Among Ages 25 to 29 years Correlation Summary
| Measurement | Immigrants from Moldova | Thai |
| Minimum | 1.2% | 0.80% |
| Maximum | 81.8% | 22.0% |
| Range | 80.6% | 21.2% |
| Mean | 10.8% | 6.2% |
| Median | 6.2% | 5.5% |
| Interquartile 25% (IQ1) | 5.7% | 4.3% |
| Interquartile 75% (IQ3) | 9.6% | 6.5% |
| Interquartile Range (IQR) | 4.0% | 2.2% |
| Standard Deviation (Sample) | 14.8% | 3.7% |
| Standard Deviation (Population) | 14.6% | 3.6% |
Similar Demographics by Unemployment Among Ages 25 to 29 years
Demographics Similar to Immigrants from Moldova by Unemployment Among Ages 25 to 29 years
In terms of unemployment among ages 25 to 29 years, the demographic groups most similar to Immigrants from Moldova are Immigrants from Uganda (6.5%, a difference of 0.0%), Immigrants from South Africa (6.5%, a difference of 0.050%), Immigrants from Belarus (6.5%, a difference of 0.090%), Chilean (6.5%, a difference of 0.10%), and Laotian (6.5%, a difference of 0.11%).
| Demographics | Rating | Rank | Unemployment Among Ages 25 to 29 years |
| Immigrants | Egypt | 87.1 /100 | #113 | Excellent 6.5% |
| Germans | 86.3 /100 | #114 | Excellent 6.5% |
| Macedonians | 86.1 /100 | #115 | Excellent 6.5% |
| Pakistanis | 85.9 /100 | #116 | Excellent 6.5% |
| Immigrants | Uruguay | 85.7 /100 | #117 | Excellent 6.5% |
| Chileans | 85.3 /100 | #118 | Excellent 6.5% |
| Immigrants | South Africa | 84.9 /100 | #119 | Excellent 6.5% |
| Immigrants | Moldova | 84.5 /100 | #120 | Excellent 6.5% |
| Immigrants | Uganda | 84.5 /100 | #121 | Excellent 6.5% |
| Immigrants | Belarus | 83.7 /100 | #122 | Excellent 6.5% |
| Laotians | 83.6 /100 | #123 | Excellent 6.5% |
| Arabs | 82.5 /100 | #124 | Excellent 6.5% |
| Syrians | 82.1 /100 | #125 | Excellent 6.5% |
| Brazilians | 81.9 /100 | #126 | Excellent 6.5% |
| Dutch | 80.6 /100 | #127 | Excellent 6.5% |
Demographics Similar to Thais by Unemployment Among Ages 25 to 29 years
In terms of unemployment among ages 25 to 29 years, the demographic groups most similar to Thais are Immigrants from Singapore (5.9%, a difference of 0.15%), Immigrants from Eritrea (5.9%, a difference of 0.18%), Bolivian (5.9%, a difference of 0.26%), Immigrants from Bulgaria (5.9%, a difference of 0.40%), and Cuban (5.9%, a difference of 0.41%).
| Demographics | Rating | Rank | Unemployment Among Ages 25 to 29 years |
| Okinawans | 100.0 /100 | #12 | Exceptional 5.9% |
| Immigrants | Bolivia | 100.0 /100 | #13 | Exceptional 5.9% |
| Immigrants | Kuwait | 99.9 /100 | #14 | Exceptional 5.9% |
| Cubans | 99.9 /100 | #15 | Exceptional 5.9% |
| Immigrants | Bulgaria | 99.9 /100 | #16 | Exceptional 5.9% |
| Bolivians | 99.9 /100 | #17 | Exceptional 5.9% |
| Immigrants | Singapore | 99.9 /100 | #18 | Exceptional 5.9% |
| Thais | 99.9 /100 | #19 | Exceptional 5.9% |
| Immigrants | Eritrea | 99.9 /100 | #20 | Exceptional 5.9% |
| Immigrants | Ethiopia | 99.9 /100 | #21 | Exceptional 6.0% |
| Immigrants | Japan | 99.9 /100 | #22 | Exceptional 6.0% |
| Immigrants | Venezuela | 99.8 /100 | #23 | Exceptional 6.0% |
| Norwegians | 99.8 /100 | #24 | Exceptional 6.0% |
| New Zealanders | 99.8 /100 | #25 | Exceptional 6.0% |
| Immigrants | Eastern Africa | 99.8 /100 | #26 | Exceptional 6.0% |