Immigrants from Morocco vs Immigrants from Bahamas Unemployment Among Ages 35 to 44 years
COMPARE
Immigrants from Morocco
Immigrants from Bahamas
Unemployment Among Ages 35 to 44 years
Unemployment Among Ages 35 to 44 years Comparison
Immigrants from Morocco
Immigrants from Bahamas
4.7%
UNEMPLOYMENT AMONG AGES 35 TO 44 YEARS
57.2/ 100
METRIC RATING
164th/ 347
METRIC RANK
5.2%
UNEMPLOYMENT AMONG AGES 35 TO 44 YEARS
0.2/ 100
METRIC RATING
254th/ 347
METRIC RANK
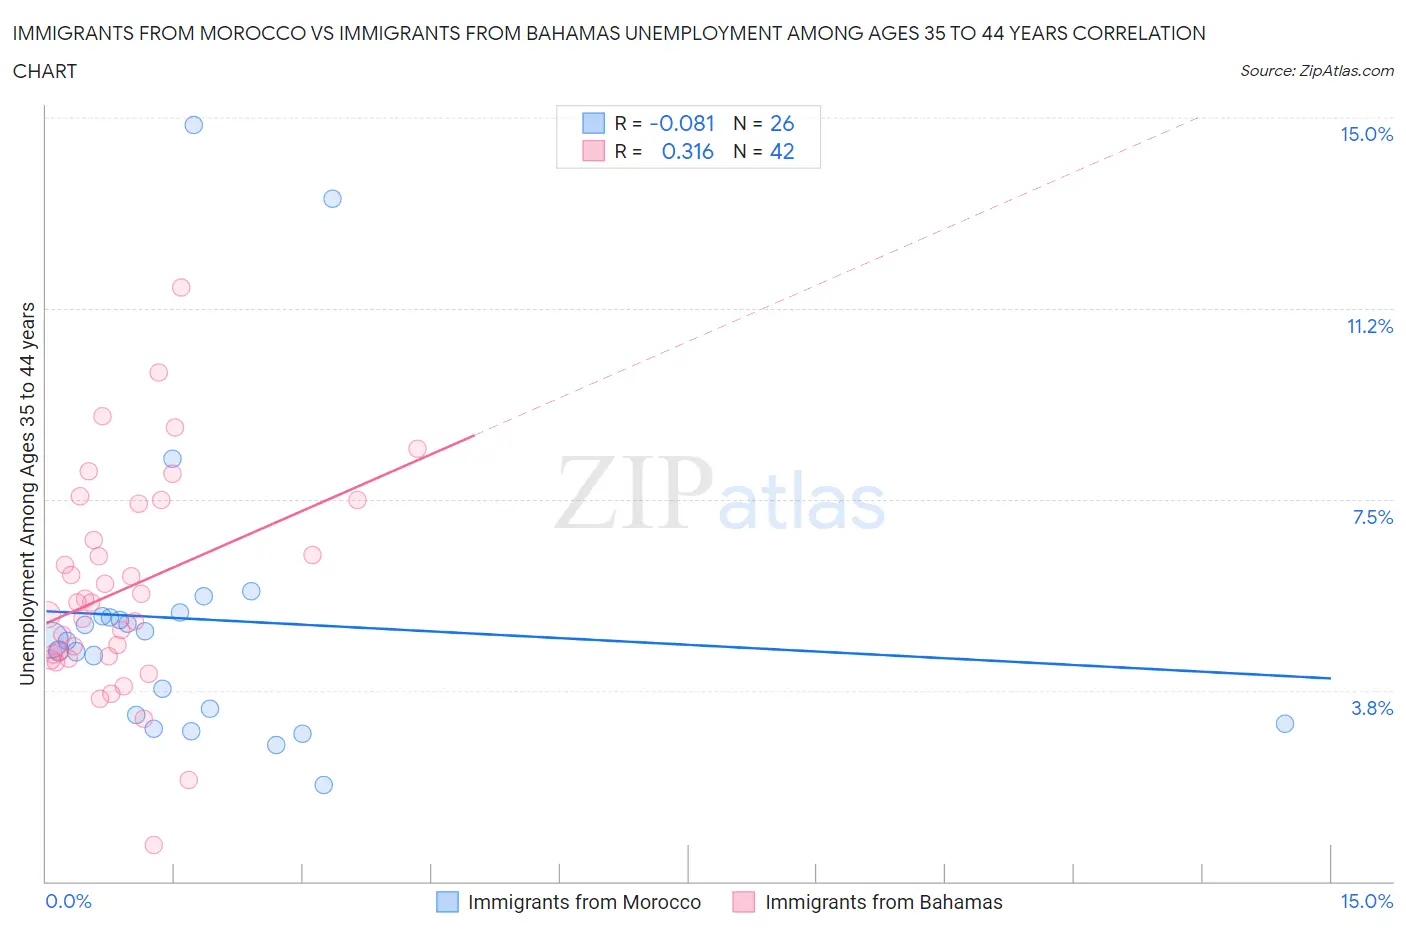
Immigrants from Morocco vs Immigrants from Bahamas Unemployment Among Ages 35 to 44 years Correlation Chart
The statistical analysis conducted on geographies consisting of 177,996,859 people shows a slight negative correlation between the proportion of Immigrants from Morocco and unemployment rate among population between the ages 35 and 44 in the United States with a correlation coefficient (R) of -0.081 and weighted average of 4.7%. Similarly, the statistical analysis conducted on geographies consisting of 103,893,363 people shows a mild positive correlation between the proportion of Immigrants from Bahamas and unemployment rate among population between the ages 35 and 44 in the United States with a correlation coefficient (R) of 0.316 and weighted average of 5.2%, a difference of 12.0%.
Unemployment Among Ages 35 to 44 years Correlation Summary
| Measurement | Immigrants from Morocco | Immigrants from Bahamas |
| Minimum | 1.9% | 0.70% |
| Maximum | 14.9% | 11.7% |
| Range | 13.0% | 11.0% |
| Mean | 5.1% | 5.8% |
| Median | 4.7% | 5.5% |
| Interquartile 25% (IQ1) | 3.3% | 4.4% |
| Interquartile 75% (IQ3) | 5.2% | 7.4% |
| Interquartile Range (IQR) | 1.9% | 3.0% |
| Standard Deviation (Sample) | 3.0% | 2.1% |
| Standard Deviation (Population) | 2.9% | 2.1% |
Similar Demographics by Unemployment Among Ages 35 to 44 years
Demographics Similar to Immigrants from Morocco by Unemployment Among Ages 35 to 44 years
In terms of unemployment among ages 35 to 44 years, the demographic groups most similar to Immigrants from Morocco are German Russian (4.7%, a difference of 0.0%), South African (4.7%, a difference of 0.090%), French (4.7%, a difference of 0.12%), Costa Rican (4.7%, a difference of 0.18%), and Peruvian (4.7%, a difference of 0.20%).
| Demographics | Rating | Rank | Unemployment Among Ages 35 to 44 years |
| Immigrants | Belarus | 63.4 /100 | #157 | Good 4.6% |
| Immigrants | Iran | 63.1 /100 | #158 | Good 4.6% |
| Albanians | 63.0 /100 | #159 | Good 4.6% |
| Hungarians | 62.6 /100 | #160 | Good 4.6% |
| Celtics | 61.7 /100 | #161 | Good 4.7% |
| Costa Ricans | 59.6 /100 | #162 | Average 4.7% |
| South Africans | 58.5 /100 | #163 | Average 4.7% |
| Immigrants | Morocco | 57.2 /100 | #164 | Average 4.7% |
| German Russians | 57.2 /100 | #165 | Average 4.7% |
| French | 55.6 /100 | #166 | Average 4.7% |
| Peruvians | 54.4 /100 | #167 | Average 4.7% |
| Arabs | 53.1 /100 | #168 | Average 4.7% |
| Pennsylvania Germans | 53.0 /100 | #169 | Average 4.7% |
| Immigrants | Indonesia | 52.6 /100 | #170 | Average 4.7% |
| Indonesians | 51.7 /100 | #171 | Average 4.7% |
Demographics Similar to Immigrants from Bahamas by Unemployment Among Ages 35 to 44 years
In terms of unemployment among ages 35 to 44 years, the demographic groups most similar to Immigrants from Bahamas are Mexican American Indian (5.2%, a difference of 0.030%), Armenian (5.2%, a difference of 0.050%), Cherokee (5.2%, a difference of 0.050%), Comanche (5.2%, a difference of 0.18%), and Seminole (5.2%, a difference of 0.31%).
| Demographics | Rating | Rank | Unemployment Among Ages 35 to 44 years |
| Immigrants | Somalia | 0.3 /100 | #247 | Tragic 5.2% |
| Alsatians | 0.2 /100 | #248 | Tragic 5.2% |
| Immigrants | Liberia | 0.2 /100 | #249 | Tragic 5.2% |
| Immigrants | El Salvador | 0.2 /100 | #250 | Tragic 5.2% |
| Comanche | 0.2 /100 | #251 | Tragic 5.2% |
| Armenians | 0.2 /100 | #252 | Tragic 5.2% |
| Mexican American Indians | 0.2 /100 | #253 | Tragic 5.2% |
| Immigrants | Bahamas | 0.2 /100 | #254 | Tragic 5.2% |
| Cherokee | 0.2 /100 | #255 | Tragic 5.2% |
| Seminole | 0.1 /100 | #256 | Tragic 5.2% |
| Immigrants | Fiji | 0.1 /100 | #257 | Tragic 5.3% |
| Immigrants | Latin America | 0.1 /100 | #258 | Tragic 5.3% |
| Mexicans | 0.1 /100 | #259 | Tragic 5.3% |
| Sub-Saharan Africans | 0.1 /100 | #260 | Tragic 5.3% |
| Spanish Americans | 0.1 /100 | #261 | Tragic 5.3% |