Delaware vs Immigrants from Bahamas Unemployment Among Ages 35 to 44 years
COMPARE
Delaware
Immigrants from Bahamas
Unemployment Among Ages 35 to 44 years
Unemployment Among Ages 35 to 44 years Comparison
Delaware
Immigrants from Bahamas
5.1%
UNEMPLOYMENT AMONG AGES 35 TO 44 YEARS
0.5/ 100
METRIC RATING
242nd/ 347
METRIC RANK
5.2%
UNEMPLOYMENT AMONG AGES 35 TO 44 YEARS
0.2/ 100
METRIC RATING
254th/ 347
METRIC RANK
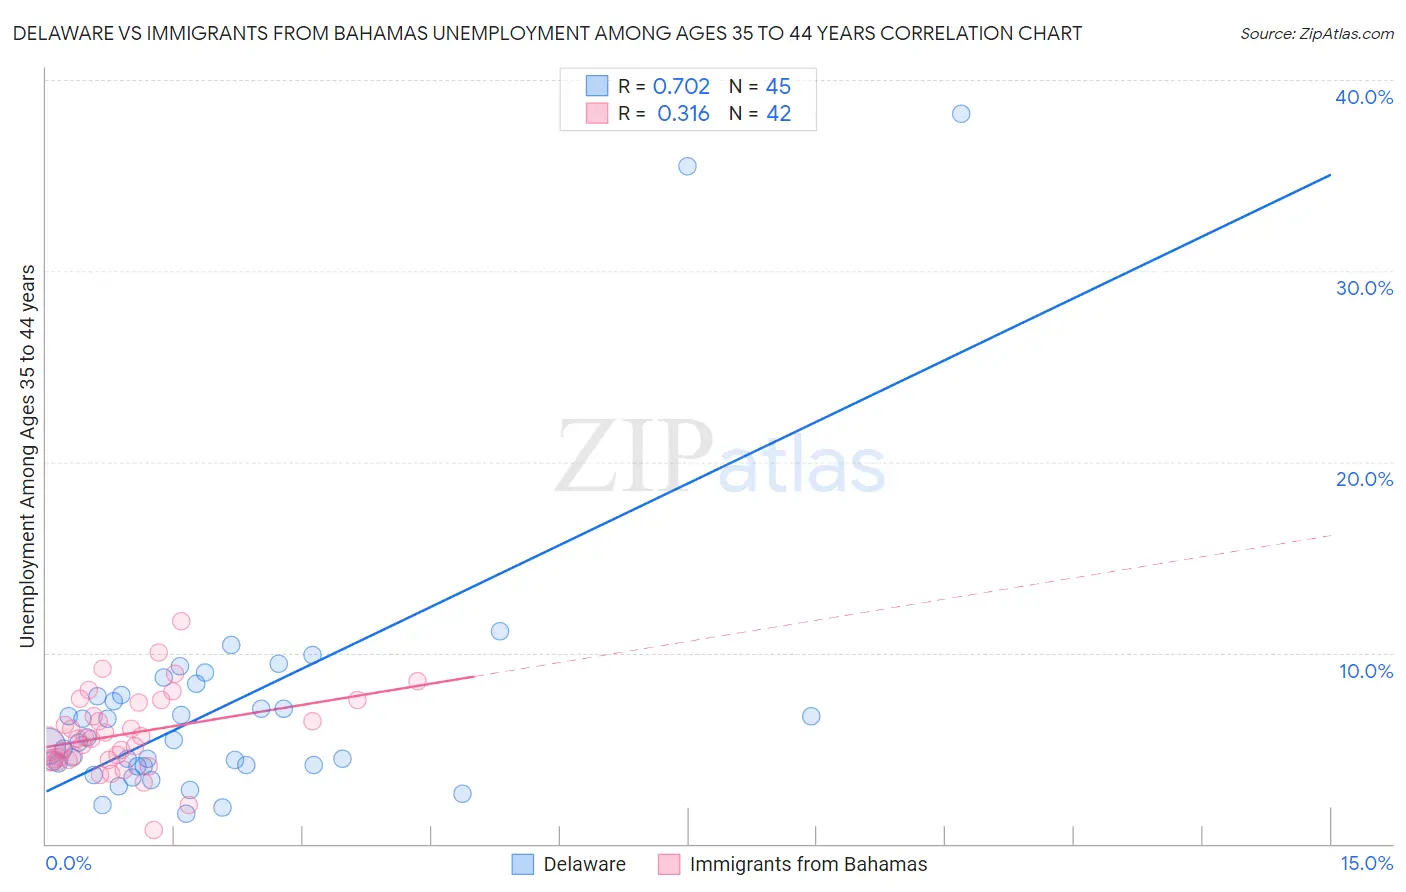
Delaware vs Immigrants from Bahamas Unemployment Among Ages 35 to 44 years Correlation Chart
The statistical analysis conducted on geographies consisting of 95,477,018 people shows a strong positive correlation between the proportion of Delaware and unemployment rate among population between the ages 35 and 44 in the United States with a correlation coefficient (R) of 0.702 and weighted average of 5.1%. Similarly, the statistical analysis conducted on geographies consisting of 103,893,363 people shows a mild positive correlation between the proportion of Immigrants from Bahamas and unemployment rate among population between the ages 35 and 44 in the United States with a correlation coefficient (R) of 0.316 and weighted average of 5.2%, a difference of 1.7%.
Unemployment Among Ages 35 to 44 years Correlation Summary
| Measurement | Delaware | Immigrants from Bahamas |
| Minimum | 1.6% | 0.70% |
| Maximum | 38.2% | 11.7% |
| Range | 36.6% | 11.0% |
| Mean | 7.1% | 5.8% |
| Median | 5.3% | 5.5% |
| Interquartile 25% (IQ1) | 4.1% | 4.4% |
| Interquartile 75% (IQ3) | 7.7% | 7.4% |
| Interquartile Range (IQR) | 3.7% | 3.0% |
| Standard Deviation (Sample) | 6.9% | 2.1% |
| Standard Deviation (Population) | 6.8% | 2.1% |
Demographics Similar to Delaware and Immigrants from Bahamas by Unemployment Among Ages 35 to 44 years
In terms of unemployment among ages 35 to 44 years, the demographic groups most similar to Delaware are Salvadoran (5.1%, a difference of 0.12%), Guatemalan (5.1%, a difference of 0.13%), Immigrants from Honduras (5.1%, a difference of 0.37%), Bahamian (5.2%, a difference of 0.38%), and Immigrants from Guatemala (5.2%, a difference of 0.38%). Similarly, the demographic groups most similar to Immigrants from Bahamas are Mexican American Indian (5.2%, a difference of 0.030%), Armenian (5.2%, a difference of 0.050%), Cherokee (5.2%, a difference of 0.050%), Comanche (5.2%, a difference of 0.18%), and Seminole (5.2%, a difference of 0.31%).
| Demographics | Rating | Rank | Unemployment Among Ages 35 to 44 years |
| Hondurans | 0.7 /100 | #238 | Tragic 5.1% |
| Nigerians | 0.7 /100 | #239 | Tragic 5.1% |
| Somalis | 0.7 /100 | #240 | Tragic 5.1% |
| Immigrants | Honduras | 0.6 /100 | #241 | Tragic 5.1% |
| Delaware | 0.5 /100 | #242 | Tragic 5.1% |
| Salvadorans | 0.4 /100 | #243 | Tragic 5.1% |
| Guatemalans | 0.4 /100 | #244 | Tragic 5.1% |
| Bahamians | 0.4 /100 | #245 | Tragic 5.2% |
| Immigrants | Guatemala | 0.4 /100 | #246 | Tragic 5.2% |
| Immigrants | Somalia | 0.3 /100 | #247 | Tragic 5.2% |
| Alsatians | 0.2 /100 | #248 | Tragic 5.2% |
| Immigrants | Liberia | 0.2 /100 | #249 | Tragic 5.2% |
| Immigrants | El Salvador | 0.2 /100 | #250 | Tragic 5.2% |
| Comanche | 0.2 /100 | #251 | Tragic 5.2% |
| Armenians | 0.2 /100 | #252 | Tragic 5.2% |
| Mexican American Indians | 0.2 /100 | #253 | Tragic 5.2% |
| Immigrants | Bahamas | 0.2 /100 | #254 | Tragic 5.2% |
| Cherokee | 0.2 /100 | #255 | Tragic 5.2% |
| Seminole | 0.1 /100 | #256 | Tragic 5.2% |
| Immigrants | Fiji | 0.1 /100 | #257 | Tragic 5.3% |
| Immigrants | Latin America | 0.1 /100 | #258 | Tragic 5.3% |