Immigrants from Morocco vs Creek Unemployment Among Ages 35 to 44 years
COMPARE
Immigrants from Morocco
Creek
Unemployment Among Ages 35 to 44 years
Unemployment Among Ages 35 to 44 years Comparison
Immigrants from Morocco
Creek
4.7%
UNEMPLOYMENT AMONG AGES 35 TO 44 YEARS
57.2/ 100
METRIC RATING
164th/ 347
METRIC RANK
5.4%
UNEMPLOYMENT AMONG AGES 35 TO 44 YEARS
0.0/ 100
METRIC RATING
274th/ 347
METRIC RANK
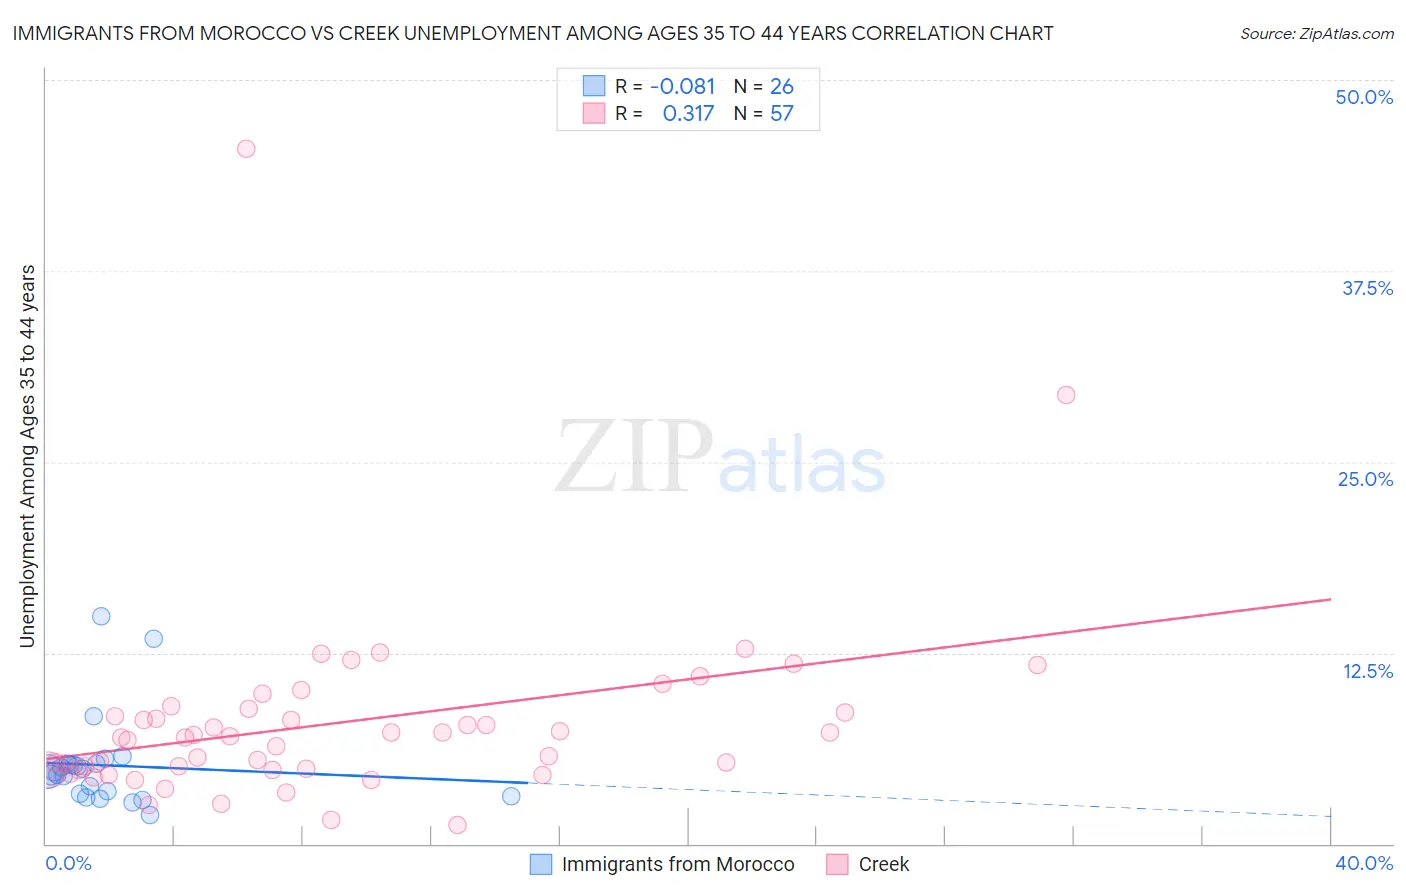
Immigrants from Morocco vs Creek Unemployment Among Ages 35 to 44 years Correlation Chart
The statistical analysis conducted on geographies consisting of 177,996,859 people shows a slight negative correlation between the proportion of Immigrants from Morocco and unemployment rate among population between the ages 35 and 44 in the United States with a correlation coefficient (R) of -0.081 and weighted average of 4.7%. Similarly, the statistical analysis conducted on geographies consisting of 176,113,795 people shows a mild positive correlation between the proportion of Creek and unemployment rate among population between the ages 35 and 44 in the United States with a correlation coefficient (R) of 0.317 and weighted average of 5.4%, a difference of 14.9%.
Unemployment Among Ages 35 to 44 years Correlation Summary
| Measurement | Immigrants from Morocco | Creek |
| Minimum | 1.9% | 1.2% |
| Maximum | 14.9% | 45.5% |
| Range | 13.0% | 44.3% |
| Mean | 5.1% | 7.9% |
| Median | 4.7% | 7.0% |
| Interquartile 25% (IQ1) | 3.3% | 4.8% |
| Interquartile 75% (IQ3) | 5.2% | 8.7% |
| Interquartile Range (IQR) | 1.9% | 3.9% |
| Standard Deviation (Sample) | 3.0% | 6.5% |
| Standard Deviation (Population) | 2.9% | 6.5% |
Similar Demographics by Unemployment Among Ages 35 to 44 years
Demographics Similar to Immigrants from Morocco by Unemployment Among Ages 35 to 44 years
In terms of unemployment among ages 35 to 44 years, the demographic groups most similar to Immigrants from Morocco are German Russian (4.7%, a difference of 0.0%), South African (4.7%, a difference of 0.090%), French (4.7%, a difference of 0.12%), Costa Rican (4.7%, a difference of 0.18%), and Peruvian (4.7%, a difference of 0.20%).
| Demographics | Rating | Rank | Unemployment Among Ages 35 to 44 years |
| Immigrants | Belarus | 63.4 /100 | #157 | Good 4.6% |
| Immigrants | Iran | 63.1 /100 | #158 | Good 4.6% |
| Albanians | 63.0 /100 | #159 | Good 4.6% |
| Hungarians | 62.6 /100 | #160 | Good 4.6% |
| Celtics | 61.7 /100 | #161 | Good 4.7% |
| Costa Ricans | 59.6 /100 | #162 | Average 4.7% |
| South Africans | 58.5 /100 | #163 | Average 4.7% |
| Immigrants | Morocco | 57.2 /100 | #164 | Average 4.7% |
| German Russians | 57.2 /100 | #165 | Average 4.7% |
| French | 55.6 /100 | #166 | Average 4.7% |
| Peruvians | 54.4 /100 | #167 | Average 4.7% |
| Arabs | 53.1 /100 | #168 | Average 4.7% |
| Pennsylvania Germans | 53.0 /100 | #169 | Average 4.7% |
| Immigrants | Indonesia | 52.6 /100 | #170 | Average 4.7% |
| Indonesians | 51.7 /100 | #171 | Average 4.7% |
Demographics Similar to Creek by Unemployment Among Ages 35 to 44 years
In terms of unemployment among ages 35 to 44 years, the demographic groups most similar to Creek are Vietnamese (5.4%, a difference of 0.040%), Immigrants from Mexico (5.4%, a difference of 0.080%), Native Hawaiian (5.4%, a difference of 0.080%), Immigrants from Caribbean (5.4%, a difference of 0.16%), and Senegalese (5.3%, a difference of 0.22%).
| Demographics | Rating | Rank | Unemployment Among Ages 35 to 44 years |
| Immigrants | Western Africa | 0.0 /100 | #267 | Tragic 5.3% |
| Hawaiians | 0.0 /100 | #268 | Tragic 5.3% |
| Cajuns | 0.0 /100 | #269 | Tragic 5.3% |
| Blackfeet | 0.0 /100 | #270 | Tragic 5.3% |
| Ute | 0.0 /100 | #271 | Tragic 5.3% |
| Senegalese | 0.0 /100 | #272 | Tragic 5.3% |
| Vietnamese | 0.0 /100 | #273 | Tragic 5.4% |
| Creek | 0.0 /100 | #274 | Tragic 5.4% |
| Immigrants | Mexico | 0.0 /100 | #275 | Tragic 5.4% |
| Native Hawaiians | 0.0 /100 | #276 | Tragic 5.4% |
| Immigrants | Caribbean | 0.0 /100 | #277 | Tragic 5.4% |
| Lumbee | 0.0 /100 | #278 | Tragic 5.4% |
| Immigrants | Senegal | 0.0 /100 | #279 | Tragic 5.4% |
| Ecuadorians | 0.0 /100 | #280 | Tragic 5.4% |
| Immigrants | Portugal | 0.0 /100 | #281 | Tragic 5.4% |