Haitian vs Alsatian Unemployment Among Ages 30 to 34 years
COMPARE
Haitian
Alsatian
Unemployment Among Ages 30 to 34 years
Unemployment Among Ages 30 to 34 years Comparison
Haitians
Alsatians
6.1%
UNEMPLOYMENT AMONG AGES 30 TO 34 YEARS
0.1/ 100
METRIC RATING
259th/ 347
METRIC RANK
5.6%
UNEMPLOYMENT AMONG AGES 30 TO 34 YEARS
14.3/ 100
METRIC RATING
206th/ 347
METRIC RANK
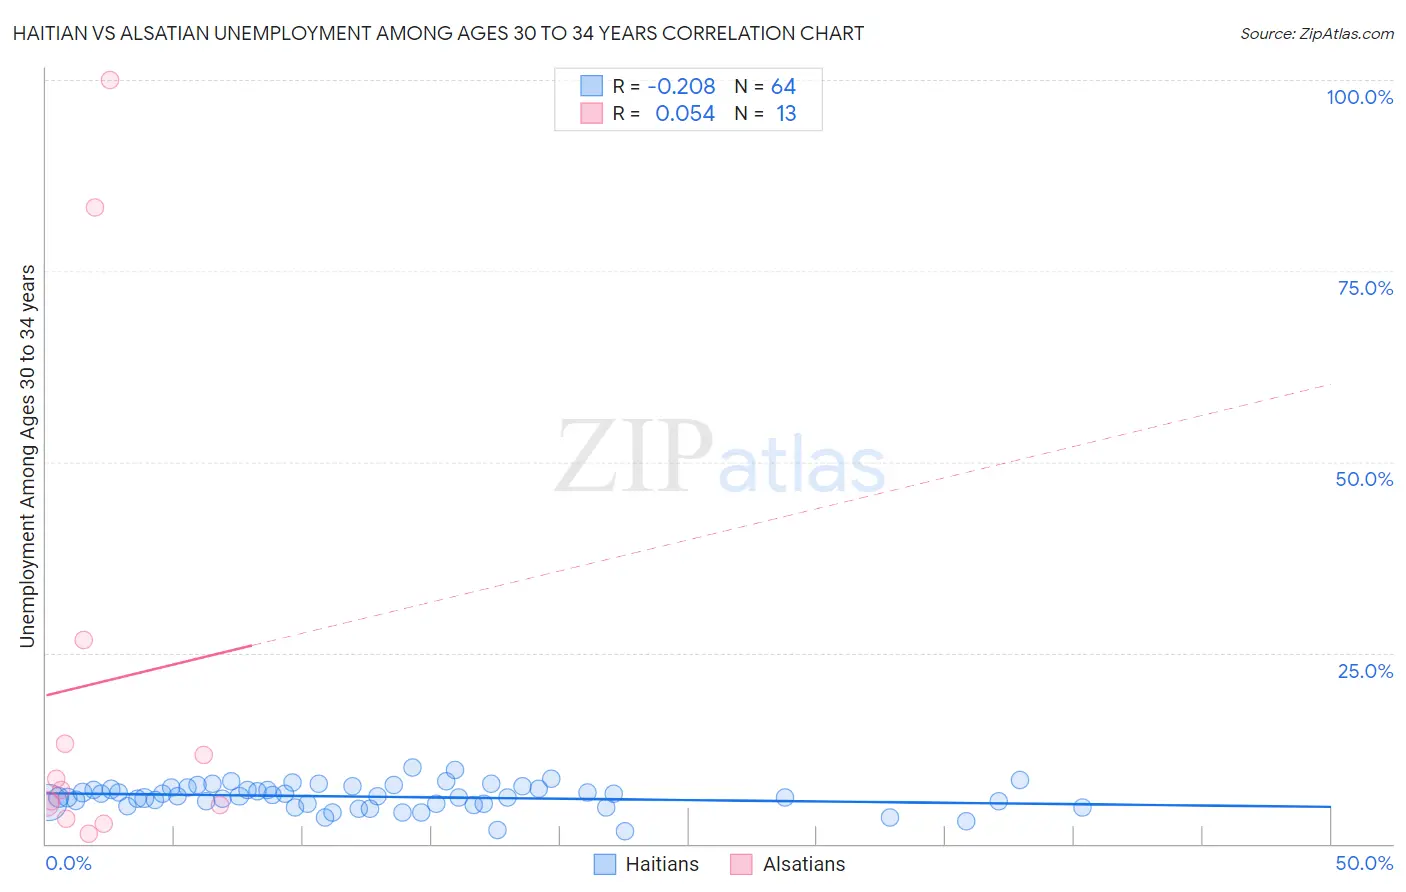
Haitian vs Alsatian Unemployment Among Ages 30 to 34 years Correlation Chart
The statistical analysis conducted on geographies consisting of 276,594,642 people shows a weak negative correlation between the proportion of Haitians and unemployment rate among population between the ages 30 and 34 in the United States with a correlation coefficient (R) of -0.208 and weighted average of 6.1%. Similarly, the statistical analysis conducted on geographies consisting of 80,588,304 people shows a slight positive correlation between the proportion of Alsatians and unemployment rate among population between the ages 30 and 34 in the United States with a correlation coefficient (R) of 0.054 and weighted average of 5.6%, a difference of 9.0%.
Unemployment Among Ages 30 to 34 years Correlation Summary
| Measurement | Haitian | Alsatian |
| Minimum | 1.7% | 1.3% |
| Maximum | 10.0% | 100.0% |
| Range | 8.3% | 98.7% |
| Mean | 6.2% | 21.0% |
| Median | 6.2% | 7.0% |
| Interquartile 25% (IQ1) | 5.2% | 4.2% |
| Interquartile 75% (IQ3) | 7.3% | 19.9% |
| Interquartile Range (IQR) | 2.0% | 15.7% |
| Standard Deviation (Sample) | 1.6% | 32.2% |
| Standard Deviation (Population) | 1.6% | 30.9% |
Similar Demographics by Unemployment Among Ages 30 to 34 years
Demographics Similar to Haitians by Unemployment Among Ages 30 to 34 years
In terms of unemployment among ages 30 to 34 years, the demographic groups most similar to Haitians are Mexican (6.1%, a difference of 0.080%), Immigrants from Sierra Leone (6.1%, a difference of 0.15%), Immigrants from Ghana (6.1%, a difference of 0.18%), Immigrants from Latin America (6.1%, a difference of 0.22%), and Immigrants from Western Africa (6.2%, a difference of 0.36%).
| Demographics | Rating | Rank | Unemployment Among Ages 30 to 34 years |
| Potawatomi | 0.2 /100 | #252 | Tragic 6.0% |
| Immigrants | Nonimmigrants | 0.2 /100 | #253 | Tragic 6.1% |
| Armenians | 0.1 /100 | #254 | Tragic 6.1% |
| Immigrants | Portugal | 0.1 /100 | #255 | Tragic 6.1% |
| Immigrants | Ghana | 0.1 /100 | #256 | Tragic 6.1% |
| Immigrants | Sierra Leone | 0.1 /100 | #257 | Tragic 6.1% |
| Mexicans | 0.1 /100 | #258 | Tragic 6.1% |
| Haitians | 0.1 /100 | #259 | Tragic 6.1% |
| Immigrants | Latin America | 0.1 /100 | #260 | Tragic 6.1% |
| Immigrants | Western Africa | 0.1 /100 | #261 | Tragic 6.2% |
| Immigrants | Central America | 0.1 /100 | #262 | Tragic 6.2% |
| Spanish Americans | 0.0 /100 | #263 | Tragic 6.2% |
| Chickasaw | 0.0 /100 | #264 | Tragic 6.2% |
| Americans | 0.0 /100 | #265 | Tragic 6.2% |
| Seminole | 0.0 /100 | #266 | Tragic 6.2% |
Demographics Similar to Alsatians by Unemployment Among Ages 30 to 34 years
In terms of unemployment among ages 30 to 34 years, the demographic groups most similar to Alsatians are Immigrants from Costa Rica (5.6%, a difference of 0.010%), Israeli (5.6%, a difference of 0.22%), Immigrants from Philippines (5.7%, a difference of 0.43%), Immigrants from Cameroon (5.6%, a difference of 0.50%), and French (5.7%, a difference of 0.55%).
| Demographics | Rating | Rank | Unemployment Among Ages 30 to 34 years |
| Nicaraguans | 26.6 /100 | #199 | Fair 5.6% |
| Immigrants | Southern Europe | 25.8 /100 | #200 | Fair 5.6% |
| South American Indians | 24.4 /100 | #201 | Fair 5.6% |
| Immigrants | Germany | 22.9 /100 | #202 | Fair 5.6% |
| Koreans | 20.7 /100 | #203 | Fair 5.6% |
| Immigrants | Cameroon | 18.4 /100 | #204 | Poor 5.6% |
| Immigrants | Costa Rica | 14.4 /100 | #205 | Poor 5.6% |
| Alsatians | 14.3 /100 | #206 | Poor 5.6% |
| Israelis | 12.8 /100 | #207 | Poor 5.6% |
| Immigrants | Philippines | 11.5 /100 | #208 | Poor 5.7% |
| French | 10.8 /100 | #209 | Poor 5.7% |
| Whites/Caucasians | 9.2 /100 | #210 | Tragic 5.7% |
| Spanish American Indians | 8.7 /100 | #211 | Tragic 5.7% |
| Scotch-Irish | 8.6 /100 | #212 | Tragic 5.7% |
| Immigrants | Immigrants | 7.1 /100 | #213 | Tragic 5.7% |