Immigrants from Middle Africa vs Immigrants from Belarus Female Unemployment
COMPARE
Immigrants from Middle Africa
Immigrants from Belarus
Female Unemployment
Female Unemployment Comparison
Immigrants from Middle Africa
Immigrants from Belarus
5.4%
FEMALE UNEMPLOYMENT
20.8/ 100
METRIC RATING
201st/ 347
METRIC RANK
5.3%
FEMALE UNEMPLOYMENT
39.4/ 100
METRIC RATING
186th/ 347
METRIC RANK
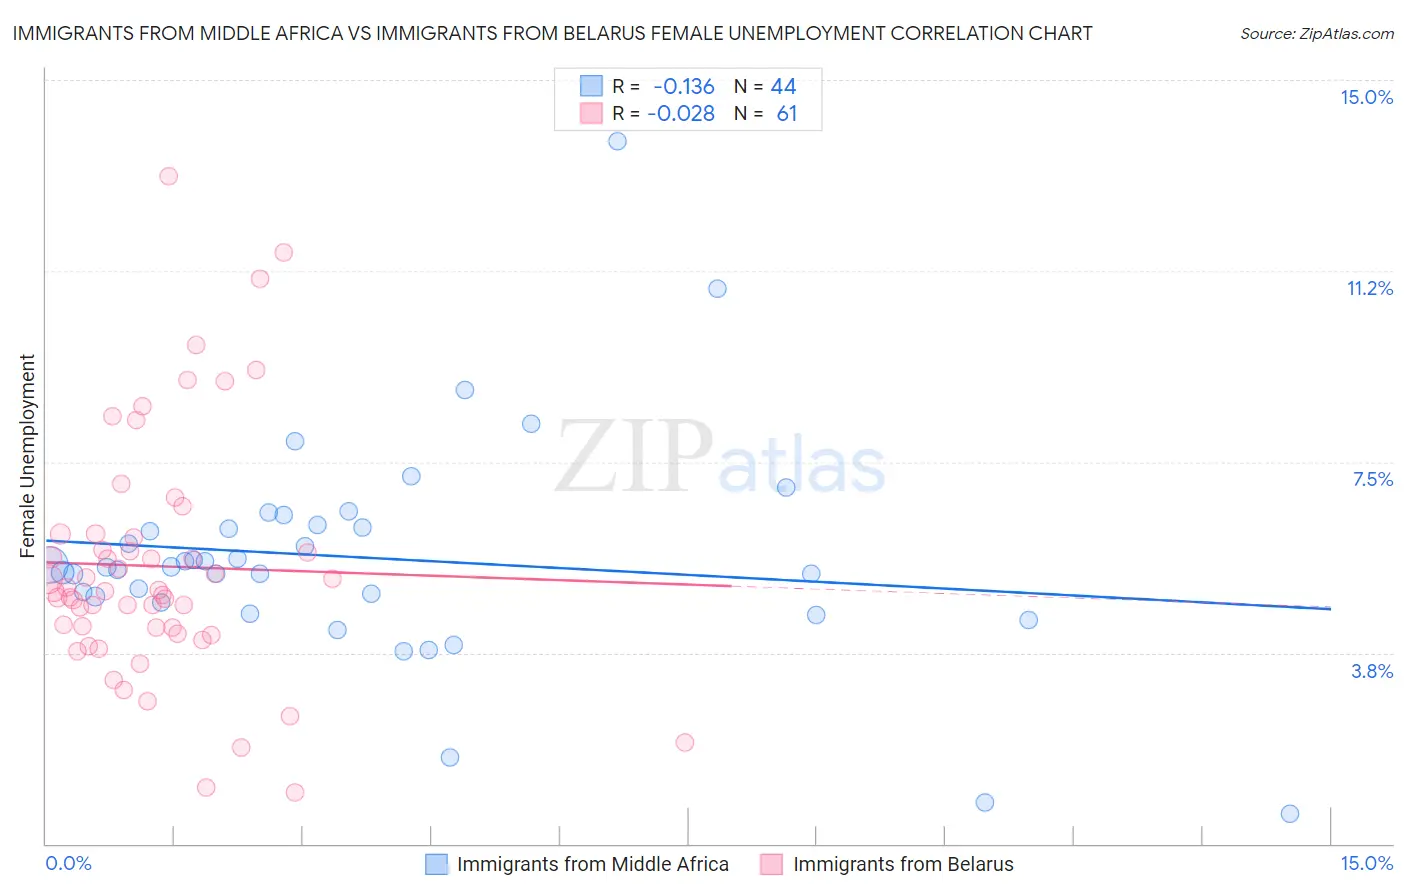
Immigrants from Middle Africa vs Immigrants from Belarus Female Unemployment Correlation Chart
The statistical analysis conducted on geographies consisting of 202,480,571 people shows a poor negative correlation between the proportion of Immigrants from Middle Africa and unemploymnet rate among females in the United States with a correlation coefficient (R) of -0.136 and weighted average of 5.4%. Similarly, the statistical analysis conducted on geographies consisting of 150,026,552 people shows no correlation between the proportion of Immigrants from Belarus and unemploymnet rate among females in the United States with a correlation coefficient (R) of -0.028 and weighted average of 5.3%, a difference of 1.3%.
Female Unemployment Correlation Summary
| Measurement | Immigrants from Middle Africa | Immigrants from Belarus |
| Minimum | 0.60% | 1.0% |
| Maximum | 13.8% | 13.1% |
| Range | 13.2% | 12.1% |
| Mean | 5.6% | 5.4% |
| Median | 5.4% | 5.0% |
| Interquartile 25% (IQ1) | 4.8% | 4.2% |
| Interquartile 75% (IQ3) | 6.2% | 6.0% |
| Interquartile Range (IQR) | 1.4% | 1.9% |
| Standard Deviation (Sample) | 2.2% | 2.4% |
| Standard Deviation (Population) | 2.2% | 2.4% |
Demographics Similar to Immigrants from Middle Africa and Immigrants from Belarus by Female Unemployment
In terms of female unemployment, the demographic groups most similar to Immigrants from Middle Africa are Iroquois (5.4%, a difference of 0.0%), Immigrants from South Eastern Asia (5.4%, a difference of 0.040%), Soviet Union (5.4%, a difference of 0.080%), Hawaiian (5.4%, a difference of 0.12%), and Tsimshian (5.4%, a difference of 0.20%). Similarly, the demographic groups most similar to Immigrants from Belarus are Malaysian (5.3%, a difference of 0.040%), Immigrants from Ukraine (5.3%, a difference of 0.050%), Immigrants from Indonesia (5.3%, a difference of 0.080%), Immigrants from Albania (5.3%, a difference of 0.26%), and Afghan (5.3%, a difference of 0.35%).
| Demographics | Rating | Rank | Female Unemployment |
| Immigrants | Indonesia | 40.7 /100 | #183 | Average 5.3% |
| Immigrants | Ukraine | 40.1 /100 | #184 | Average 5.3% |
| Malaysians | 40.1 /100 | #185 | Average 5.3% |
| Immigrants | Belarus | 39.4 /100 | #186 | Fair 5.3% |
| Immigrants | Albania | 35.4 /100 | #187 | Fair 5.3% |
| Afghans | 33.9 /100 | #188 | Fair 5.3% |
| Costa Ricans | 33.8 /100 | #189 | Fair 5.3% |
| Ugandans | 31.2 /100 | #190 | Fair 5.3% |
| Cherokee | 30.8 /100 | #191 | Fair 5.3% |
| Portuguese | 28.6 /100 | #192 | Fair 5.3% |
| Arabs | 27.7 /100 | #193 | Fair 5.3% |
| Colombians | 27.0 /100 | #194 | Fair 5.3% |
| Immigrants | Colombia | 26.2 /100 | #195 | Fair 5.3% |
| Spaniards | 25.2 /100 | #196 | Fair 5.3% |
| Alsatians | 23.9 /100 | #197 | Fair 5.3% |
| Tsimshian | 23.1 /100 | #198 | Fair 5.4% |
| Hawaiians | 22.2 /100 | #199 | Fair 5.4% |
| Soviet Union | 21.7 /100 | #200 | Fair 5.4% |
| Immigrants | Middle Africa | 20.8 /100 | #201 | Fair 5.4% |
| Iroquois | 20.8 /100 | #202 | Fair 5.4% |
| Immigrants | South Eastern Asia | 20.3 /100 | #203 | Fair 5.4% |