Immigrants from Middle Africa vs Ugandan Female Unemployment

COMPARE

Immigrants from Middle Africa
Race
Ancestry
AfghanAfricanAlaska NativeAlaskan AthabascanAlbanianAleutAlsatianAmericanApacheArabArapahoArgentineanArmenianAssyrian/Chaldean/SyriacAustralianAustrianBahamianBangladeshiBarbadianBasqueBelgianBelizeanBermudanBhutaneseBlackfeetBolivianBrazilianBritishBritish West IndianBulgarianBurmeseCajunCambodianCanadianCape VerdeanCarpatho RusynCelticCentral AmericanCentral American IndianCherokeeCheyenneChickasawChileanChineseChippewaChoctawColombianColvilleComancheCosta RicanCreeCreekCroatianCrowCubanCypriotCzechCzechoslovakianDanishDelawareDominicanDutchDutch West IndianEastern EuropeanEcuadorianEgyptianEnglishEstonianEthiopianEuropeanFijianFilipinoFinnishFrenchFrench American IndianFrench CanadianGermanGerman RussianGhanaianGreekGuamanian/ChamorroGuatemalanGuyaneseHaitianHmongHonduranHopiHoumaHungarianIcelanderIndian (Asian)IndonesianInupiatIranianIraqiIrishIroquoisIsraeliItalianJamaicanJapaneseJordanianKenyanKiowaKoreanLaotianLatvianLebaneseLiberianLithuanianLumbeeLuxembourgerMacedonianMalaysianMalteseMarshalleseMenomineeMexicanMexican American IndianMongolianMoroccanNative HawaiianNavajoNepaleseNew ZealanderNicaraguanNigerianNorthern EuropeanNorwegianOkinawanOsageOttawaPaiutePakistaniPalestinianPanamanianParaguayanPennsylvania GermanPeruvianPimaPolishPortuguesePotawatomiPuebloPuerto RicanPuget Sound SalishRomanianRussianSalvadoranSamoanScandinavianScotch-IrishScottishSeminoleSenegaleseSerbianShoshoneSierra LeoneanSiouxSlavicSlovakSloveneSomaliSouth AfricanSouth AmericanSouth American IndianSoviet UnionSpaniardSpanishSpanish AmericanSpanish American IndianSri LankanSubsaharan AfricanSudaneseSwedishSwissSyrianTaiwaneseThaiTlingit-HaidaTohono O'OdhamTonganTrinidadian and TobagonianTsimshianTurkishU.S. Virgin IslanderUkrainianUruguayanUteVenezuelanVietnameseWelshWest IndianYakamaYaquiYugoslavianYumanYup'ikZimbabwean
Immigration
NonimmigrantsImmigrantsAfghanistanAfricaAlbaniaArgentinaArmeniaAsiaAustraliaAustriaBahamasBangladeshBarbadosBelarusBelgiumBelizeBoliviaBosnia and HerzegovinaBrazilBulgariaBurma/MyanmarCabo VerdeCambodiaCameroonCanadaCaribbeanCentral AmericaChileChinaColombiaCongoCosta RicaCroatiaCubaCzechoslovakiaDenmarkDominicaDominican RepublicEastern AfricaEastern AsiaEastern EuropeEcuadorEgyptEl SalvadorEnglandEritreaEthiopiaEuropeFijiFranceGermanyGhanaGreeceGrenadaGuatemalaGuyanaHaitiHondurasHong KongHungaryIndiaIndonesiaIranIraqIrelandIsraelItalyJamaicaJapanJordanKazakhstanKenyaKoreaKuwaitLaosLatin AmericaLatviaLebanonLiberiaLithuaniaMalaysiaMexicoMicronesiaMiddle AfricaMoldovaMoroccoNepalNetherlandsNicaraguaNigeriaNorth AmericaNorth MacedoniaNorthern AfricaNorthern EuropeNorwayOceaniaPakistanPanamaPeruPhilippinesPolandPortugalRomaniaRussiaSaudi ArabiaScotlandSenegalSerbiaSierra LeoneSingaporeSomaliaSouth AfricaSouth AmericaSouth Central AsiaSouth Eastern AsiaSouthern EuropeSpainSri LankaSt. Vincent and the GrenadinesSudanSwedenSwitzerlandSyriaTaiwanThailandTrinidad and TobagoTurkeyUgandaUkraineUruguayUzbekistanVenezuelaVietnamWest IndiesWestern AfricaWestern AsiaWestern EuropeYemenZaireZimbabweAzores
Ugandan
Race
Ancestry
AfghanAfricanAlaska NativeAlaskan AthabascanAlbanianAleutAlsatianAmericanApacheArabArapahoArgentineanArmenianAssyrian/Chaldean/SyriacAustralianAustrianBahamianBangladeshiBarbadianBasqueBelgianBelizeanBermudanBhutaneseBlackfeetBolivianBrazilianBritishBritish West IndianBulgarianBurmeseCajunCambodianCanadianCape VerdeanCarpatho RusynCelticCentral AmericanCentral American IndianCherokeeCheyenneChickasawChileanChineseChippewaChoctawColombianColvilleComancheCosta RicanCreeCreekCroatianCrowCubanCypriotCzechCzechoslovakianDanishDelawareDominicanDutchDutch West IndianEastern EuropeanEcuadorianEgyptianEnglishEstonianEthiopianEuropeanFijianFilipinoFinnishFrenchFrench American IndianFrench CanadianGermanGerman RussianGhanaianGreekGuamanian/ChamorroGuatemalanGuyaneseHaitianHmongHonduranHopiHoumaHungarianIcelanderIndian (Asian)IndonesianInupiatIranianIraqiIrishIroquoisIsraeliItalianJamaicanJapaneseJordanianKenyanKiowaKoreanLaotianLatvianLebaneseLiberianLithuanianLumbeeLuxembourgerMacedonianMalaysianMalteseMarshalleseMenomineeMexicanMexican American IndianMongolianMoroccanNative HawaiianNavajoNepaleseNew ZealanderNicaraguanNigerianNorthern EuropeanNorwegianOkinawanOsageOttawaPaiutePakistaniPalestinianPanamanianParaguayanPennsylvania GermanPeruvianPimaPolishPortuguesePotawatomiPuebloPuerto RicanPuget Sound SalishRomanianRussianSalvadoranSamoanScandinavianScotch-IrishScottishSeminoleSenegaleseSerbianShoshoneSierra LeoneanSiouxSlavicSlovakSloveneSomaliSouth AfricanSouth AmericanSouth American IndianSoviet UnionSpaniardSpanishSpanish AmericanSpanish American IndianSri LankanSubsaharan AfricanSudaneseSwedishSwissSyrianTaiwaneseThaiTlingit-HaidaTohono O'OdhamTonganTrinidadian and TobagonianTsimshianTurkishU.S. Virgin IslanderUgandanUkrainianUruguayanUteVenezuelanVietnameseWelshWest IndianYakamaYaquiYugoslavianYumanYup'ikZimbabwean
Immigration
NonimmigrantsImmigrantsAfghanistanAfricaAlbaniaArgentinaArmeniaAsiaAustraliaAustriaBahamasBangladeshBarbadosBelarusBelgiumBelizeBoliviaBosnia and HerzegovinaBrazilBulgariaBurma/MyanmarCabo VerdeCambodiaCameroonCanadaCaribbeanCentral AmericaChileChinaColombiaCongoCosta RicaCroatiaCubaCzechoslovakiaDenmarkDominicaDominican RepublicEastern AfricaEastern AsiaEastern EuropeEcuadorEgyptEl SalvadorEnglandEritreaEthiopiaEuropeFijiFranceGermanyGhanaGreeceGrenadaGuatemalaGuyanaHaitiHondurasHong KongHungaryIndiaIndonesiaIranIraqIrelandIsraelItalyJamaicaJapanJordanKazakhstanKenyaKoreaKuwaitLaosLatin AmericaLatviaLebanonLiberiaLithuaniaMalaysiaMexicoMicronesiaMoldovaMoroccoNepalNetherlandsNicaraguaNigeriaNorth AmericaNorth MacedoniaNorthern AfricaNorthern EuropeNorwayOceaniaPakistanPanamaPeruPhilippinesPolandPortugalRomaniaRussiaSaudi ArabiaScotlandSenegalSerbiaSierra LeoneSingaporeSomaliaSouth AfricaSouth AmericaSouth Central AsiaSouth Eastern AsiaSouthern EuropeSpainSri LankaSt. Vincent and the GrenadinesSudanSwedenSwitzerlandSyriaTaiwanThailandTrinidad and TobagoTurkeyUgandaUkraineUruguayUzbekistanVenezuelaVietnamWest IndiesWestern AfricaWestern AsiaWestern EuropeYemenZaireZimbabweAzores
Female Unemployment
Income
Poverty
Unemployment
Labor Participation
Family Structure
Vehicle Availability
Education Level
Disability

Female Unemployment Comparison

Immigrants from Middle Africa

Ugandans

Fair
Fair
5.4%
FEMALE UNEMPLOYMENT
20.8/ 100
METRIC RATING
201st/ 347
METRIC RANK
5.3%
FEMALE UNEMPLOYMENT
31.2/ 100
METRIC RATING
190th/ 347
METRIC RANK

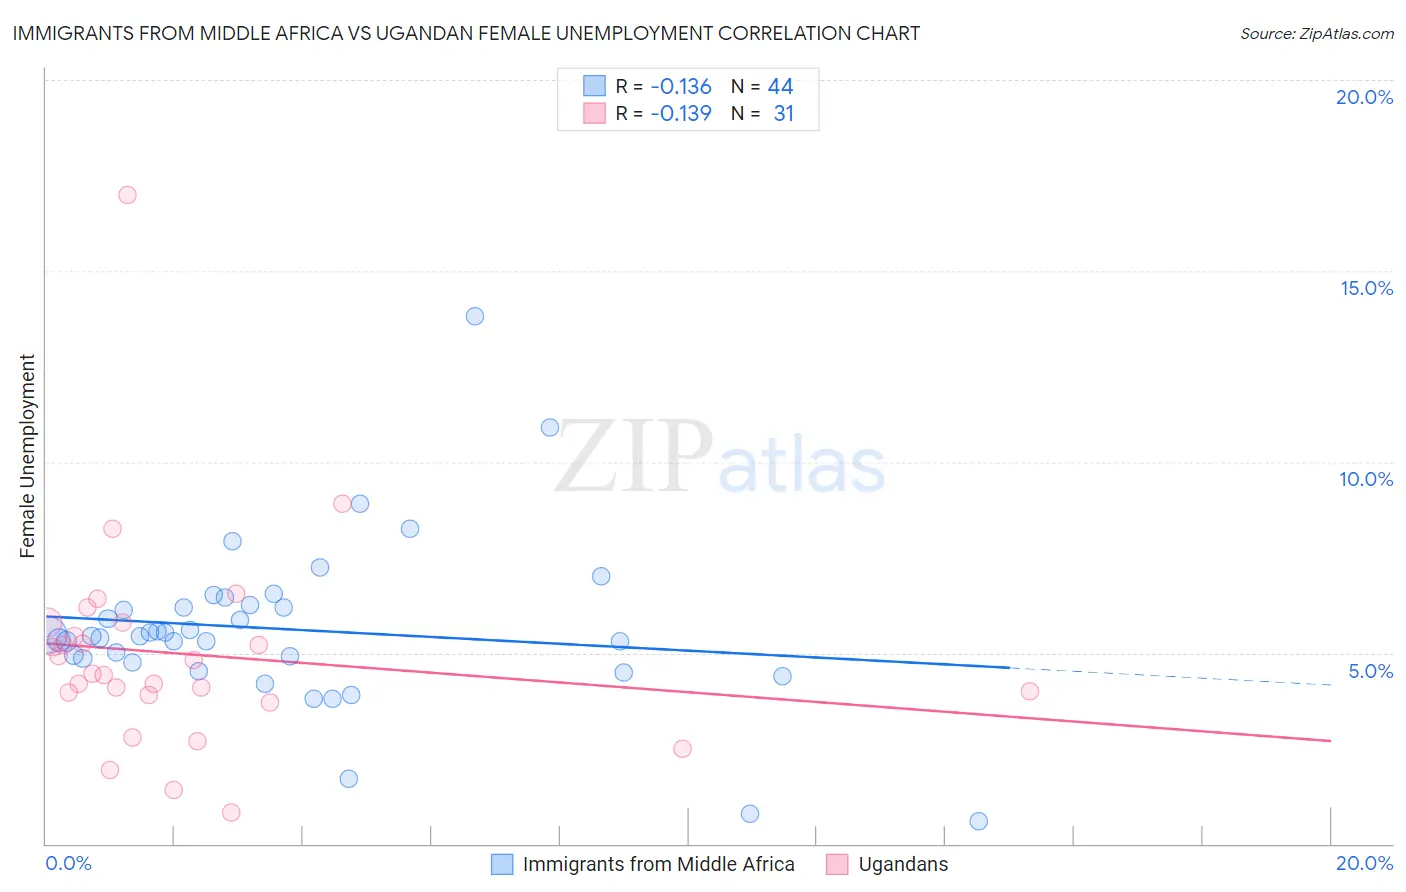
Immigrants from Middle Africa vs Ugandan Female Unemployment Correlation Chart

The statistical analysis conducted on geographies consisting of 202,480,571 people shows a poor negative correlation between the proportion of Immigrants from Middle Africa and unemploymnet rate among females in the United States with a correlation coefficient (R) of -0.136 and weighted average of 5.4%. Similarly, the statistical analysis conducted on geographies consisting of 93,949,497 people shows a poor negative correlation between the proportion of Ugandans and unemploymnet rate among females in the United States with a correlation coefficient (R) of -0.139 and weighted average of 5.3%, a difference of 0.81%.
Immigrants from Middle Africa vs Ugandan Female Unemployment

Female Unemployment Correlation Summary

MeasurementImmigrants from Middle AfricaUgandan
Minimum0.60%0.82%
Maximum13.8%17.0%
Range13.2%16.2%
Mean5.6%5.0%
Median5.4%4.4%
Interquartile 25% (IQ1)4.8%3.9%
Interquartile 75% (IQ3)6.2%5.8%
Interquartile Range (IQR)1.4%1.9%
Standard Deviation (Sample)2.2%2.8%
Standard Deviation (Population)2.2%2.8%

Demographics Similar to Immigrants from Middle Africa and Ugandans by Female Unemployment

In terms of female unemployment, the demographic groups most similar to Immigrants from Middle Africa are Iroquois (5.4%, a difference of 0.0%), Immigrants from South Eastern Asia (5.4%, a difference of 0.040%), Soviet Union (5.4%, a difference of 0.080%), Immigrants from Israel (5.4%, a difference of 0.10%), and Hawaiian (5.4%, a difference of 0.12%). Similarly, the demographic groups most similar to Ugandans are Cherokee (5.3%, a difference of 0.030%), Afghan (5.3%, a difference of 0.18%), Costa Rican (5.3%, a difference of 0.18%), Portuguese (5.3%, a difference of 0.18%), and Arab (5.3%, a difference of 0.25%).
DemographicsRating | RankFemale Unemployment
Malaysians
40.1
/100
|
#185
Average
5.3%
Immigrants | Belarus
39.4
/100
|
#186
Fair
5.3%
Immigrants | Albania
35.4
/100
|
#187
Fair
5.3%
Afghans
33.9
/100
|
#188
Fair
5.3%
Costa Ricans
33.8
/100
|
#189
Fair
5.3%
Ugandans
31.2
/100
|
#190
Fair
5.3%
Cherokee
30.8
/100
|
#191
Fair
5.3%
Portuguese
28.6
/100
|
#192
Fair
5.3%
Arabs
27.7
/100
|
#193
Fair
5.3%
Colombians
27.0
/100
|
#194
Fair
5.3%
Immigrants | Colombia
26.2
/100
|
#195
Fair
5.3%
Spaniards
25.2
/100
|
#196
Fair
5.3%
Alsatians
23.9
/100
|
#197
Fair
5.3%
Tsimshian
23.1
/100
|
#198
Fair
5.4%
Hawaiians
22.2
/100
|
#199
Fair
5.4%
Soviet Union
21.7
/100
|
#200
Fair
5.4%
Immigrants | Middle Africa
20.8
/100
|
#201
Fair
5.4%
Iroquois
20.8
/100
|
#202
Fair
5.4%
Immigrants | South Eastern Asia
20.3
/100
|
#203
Fair
5.4%
Immigrants | Israel
19.7
/100
|
#204
Poor
5.4%
Immigrants | Afghanistan
18.9
/100
|
#205
Poor
5.4%